A Beginner’s Guide to Pairs Trading
What is pairs trading, you might wonder? Let us explain it simply. Sometimes, things that usually move together get out of sync. Imagine two friends who always ride their bikes together. Most of the time, they’re side-by-side. But maybe they hit a patch of traffic, and one has to slow down while the other zips ahead briefly. You know they’re heading to the same place, though, so you expect them to adjust their speed and ride together again soon. In the world of finance, assets whose fundamental value is connected often move together in a similar way. That connection is exactly what we’re looking for to examine in today’s article. This article will be a little different than normal crypto chart reading
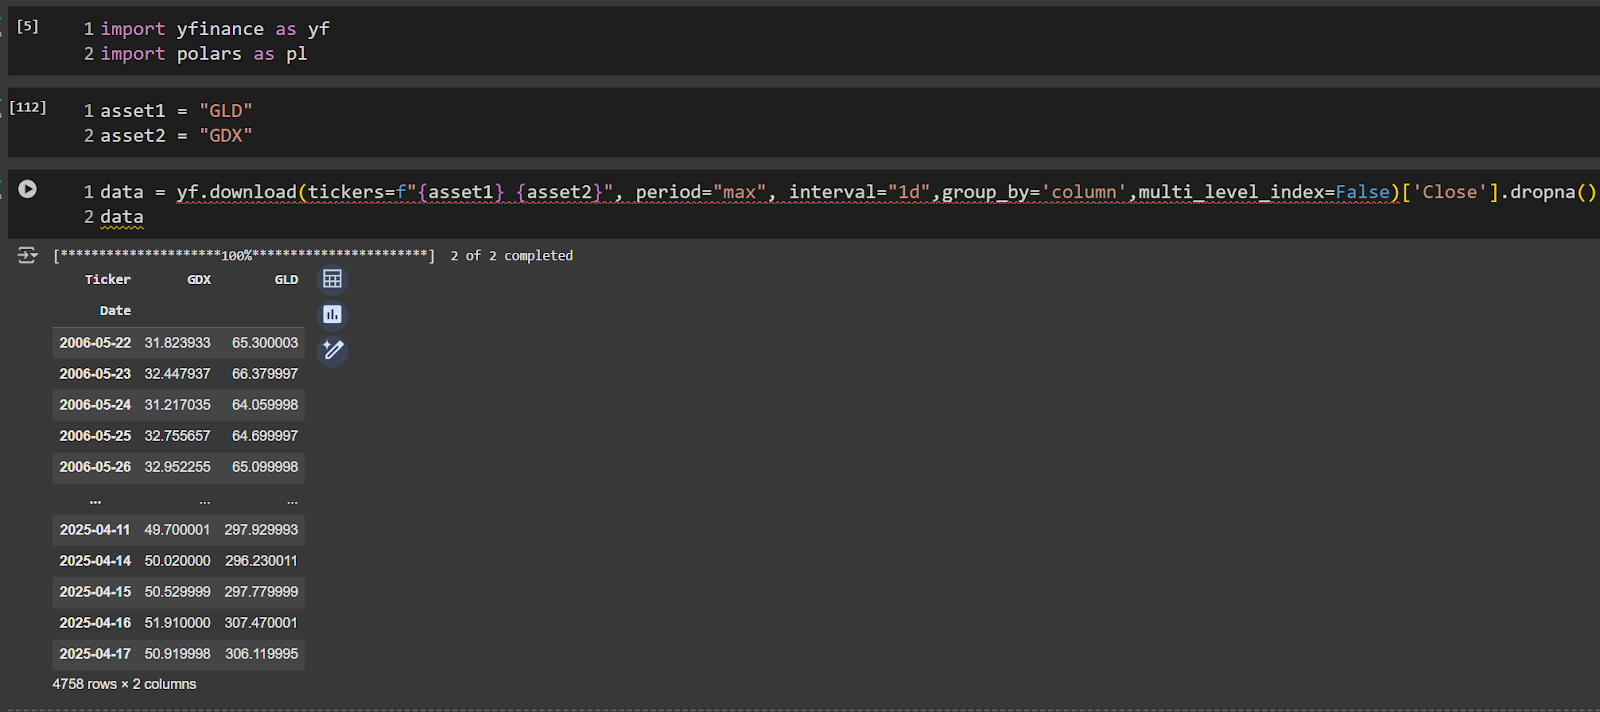
We’re going to explore this relationship from a beginner’s perspective – someone with absolutely no experience in algorithmic trading. We will try our best to explain things slowly and easily to understand, using simple ideas and analogies. The two specific “buddies” we’ll look at are GLD, an investment fund that essentially tracks the price of physical gold, and GDX, another fund that invests in companies that mine gold. Since miners’ profits are heavily tied to the price of gold, their stock prices (and thus the GDX fund’s value) tend to follow gold’s price, but not perfectly. This makes them potentially good candidates for our “buddy system” strategy.
This article is strictly for educational purposes only, meant to help you understand the concepts. It is absolutely not financial advice, and any trading involves significant risk.
Understanding Pairs Trading – The Buddy System of the Market
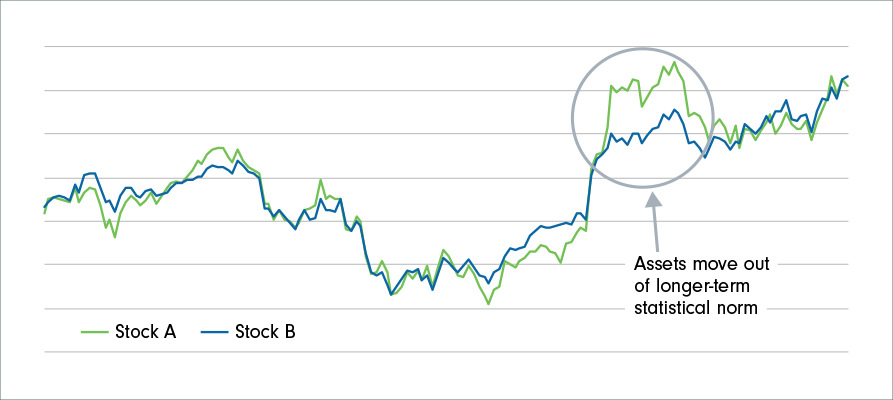
Let’s look at our buddies, GLD and GDX. They’re linked because gold prices heavily influence mining company profits. While they tend to move together, they don’t move identically. Pairs trading capitalizes on this: if their prices get unusually far apart, we expect them to come back towards their historical norm. You bet on this convergence by simultaneously buying the asset that seems relatively “cheap” and selling the one that seems relatively “expensive.” Unlike simply betting if the market goes up or down, you’re betting on how these two assets move relative to each other. The main risk? If the relationship breaks down permanently, and they don’t revert, you could lose money.
Getting the Historical Data
To understand their normal relationship, we need to look at history – like checking old photos to see how your height compared to your friend’s over time. We use tools to download historical adjusted closing prices for both GLD and GDX over several years. “Adjusted” prices are important as they account for things like stock splits, giving us a clean, continuous view of their price history.
Finding the “Normal” Relationship – How Many GDXs Balance a GLD?
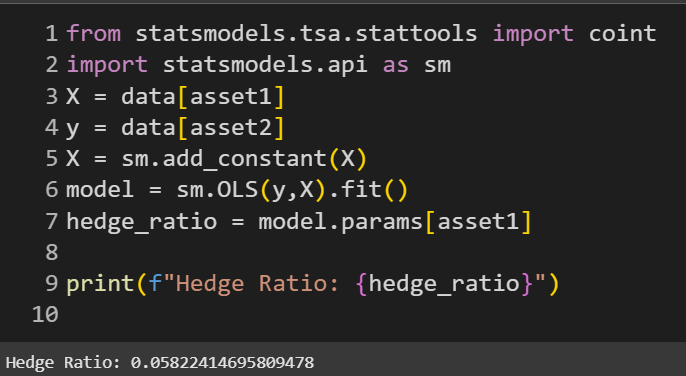
GLD and GDX have different prices and don’t move dollar-for-dollar. To compare them properly, we find a “Hedge Ratio.” This is like figuring out how many GDX shares historically moved the same amount as one GLD share, based on their past prices. We calculate this statistically (often using regression, which finds the best-fit line through their historical prices). If the ratio is 0.05, it suggests GLD typically moves 20 times as much as GDX in dollar terms.
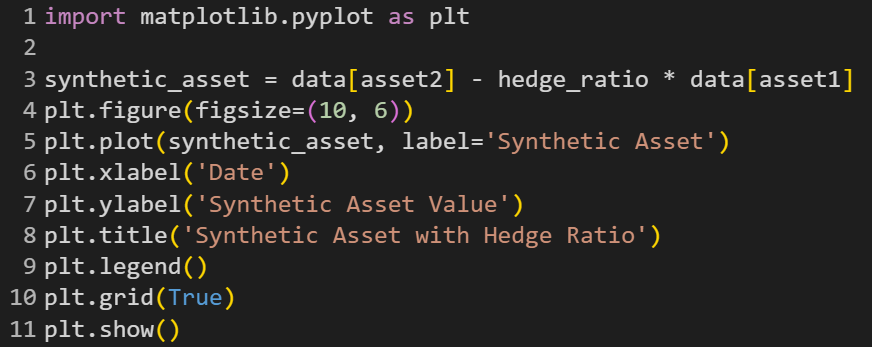
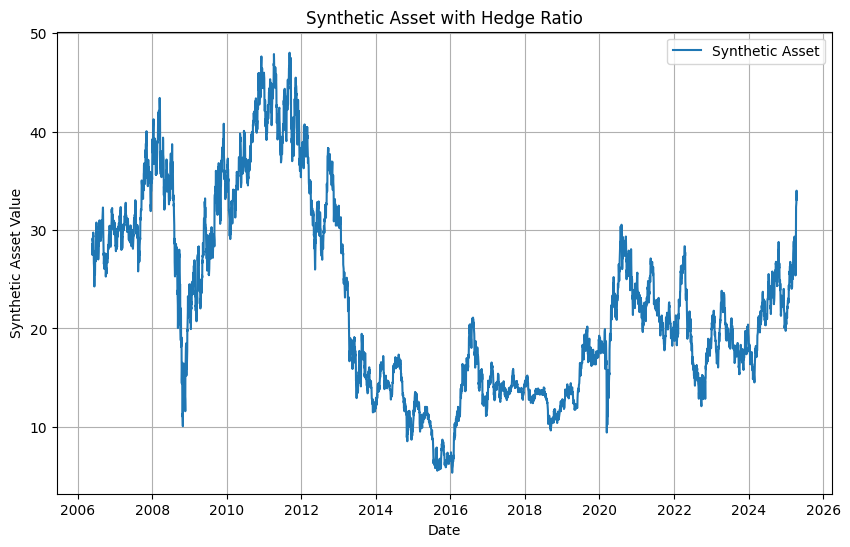
Using this ratio, we calculate the “Spread” for each day: Spread = GLD Price – (Hedge Ratio * GDX Price). This Spread tells us how far apart their prices are after accounting for their normal link.
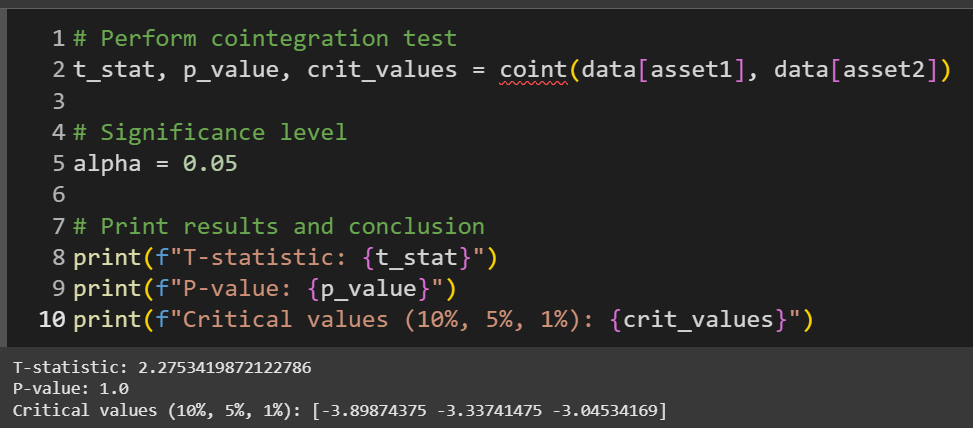
Does this “Spread” number actually tend to return to an average, or does it just wander off? If it just wanders, the strategy won’t work. We use a statistical check (like the Augmented Dickey-Fuller test, part of ‘cointegration’) to see if the Spread is ‘stationary’ – meaning its value tends to stick around a stable average. A good test result (a low p-value) suggests the Spread is likely mean-reverting, supporting our strategy’s core idea for the historical period.
Knowing when to trade and when not to
Does this “Spread” number actually tend to return to an average, or does it just wander off? If it just wanders, the strategy won’t work. We use a statistical check (like the Augmented Dickey-Fuller test, part of ‘cointegration’) to see if the Spread is ‘stationary’ – meaning its value tends to stick around a stable average. A good test result (a low p-value) suggests the Spread is likely mean-reverting, supporting our strategy’s core idea for the historical period.
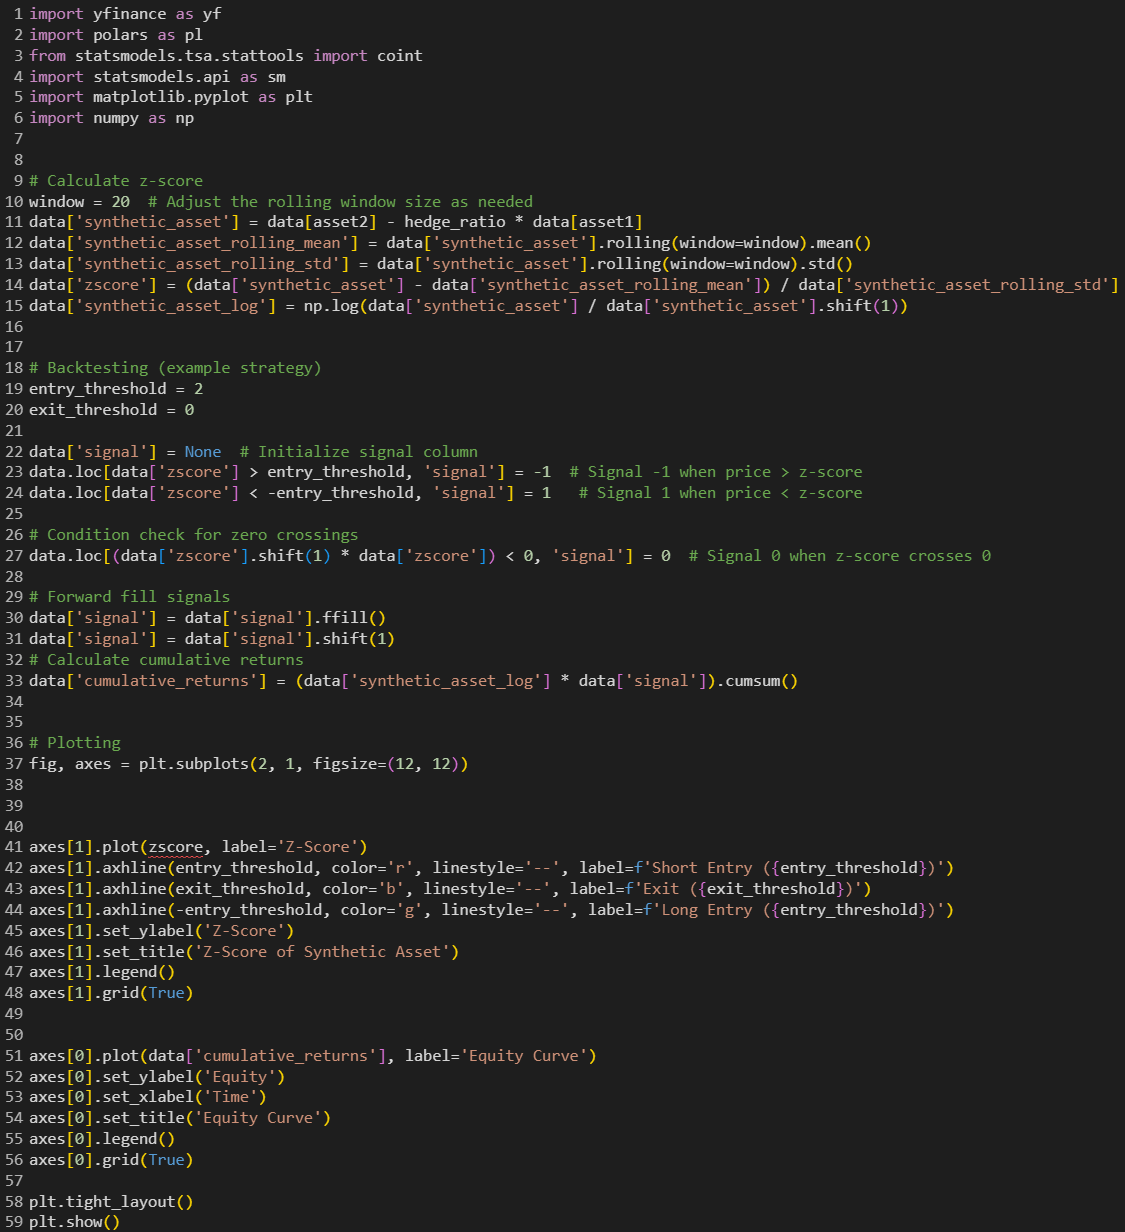
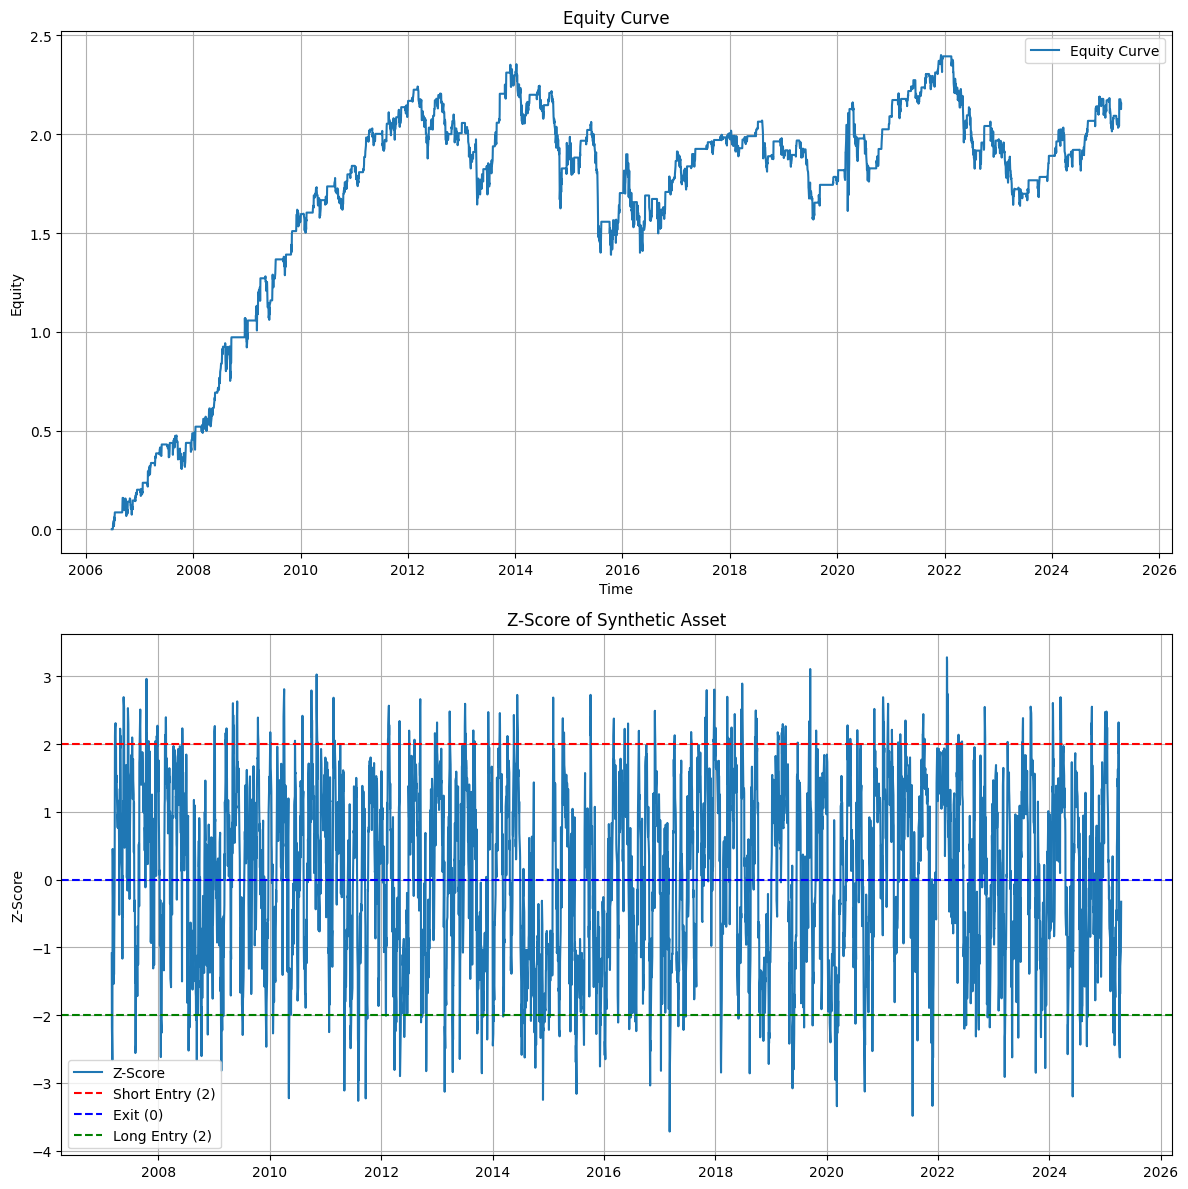
The raw Spread value isn’t always easy to read. Is a $5 Spread wide today compared to last year? The Z-score helps! It measures how many “typical wiggles” (standard deviations) the current Spread is away from its recent average (over a rolling window, like 90 days).
Z-score = (Current Spread – Recent Average Spread) / (Recent Typical Fluctuation)
If the Z-score is +2, the Spread is two typical wiggles wider than usual. If it’s -2, it’s two wiggles narrower.
We use this score for signals:
Entry: If Z-score goes above a threshold (e.g., +2.0), Short the Spread (Buy GLD, Sell GDX) expecting it to narrow. If Z-score goes below a threshold (e.g., -2.0), Long the Spread (Sell GLD, Buy GDX) expecting it to widen.
Close: If Z-score crossed zero, we close the postion
Conclusion
We explored pairs trading using GLD and GDX, learning to identify their historical link (hedge ratio), check if the relationship tends to revert (stationarity), signal trades when the Spread is unusual (Z-score), exit on reversion (Spread crossing EMA), and manage risk (stop loss).
Our historical backtest provided results showing [Reiterate very briefly, e.g., “a theoretical profit” or “challenges”]. However, remember: past performance is not a guarantee of future results. Backtests are simplified and don’t include real costs like commissions and slippage, which reduce actual profit. The main risk is the relationship breaking down.Pairs trading offers a unique way to approach markets. Building and testing strategies like this is a valuable learning exercise, highlighting the power of defined rules, statistical analysis, and crucial risk management. It’s a complex but fascinating area for anyone interested in how quantitative ideas can be applied to trading. To understand more about risk you could check on this article that we wrote here
Financial Disclaimer: The content published on Cryptothreads does not constitute financial, investment, legal, or tax advice. We are not financial advisors, and any opinions, analysis, or recommendations provided are purely informational. Cryptocurrency markets are highly volatile, and investing in digital assets carries substantial risk. Always conduct your own research and consult with a professional financial advisor before making any investment decisions. Cryptothreads is not liable for any financial losses or damages resulting from actions taken based on our content.