Bitcoin, Ethereum and Solana: On-chain Market Analysis
Overview of the Crypto Market in Mid-2025
The current cryptocurrency market is experiencing a particularly fascinating phase in mid-2025. To understand the situation clearly, we will analyze three key factors currently shaping market dynamics through on-chain analysis.
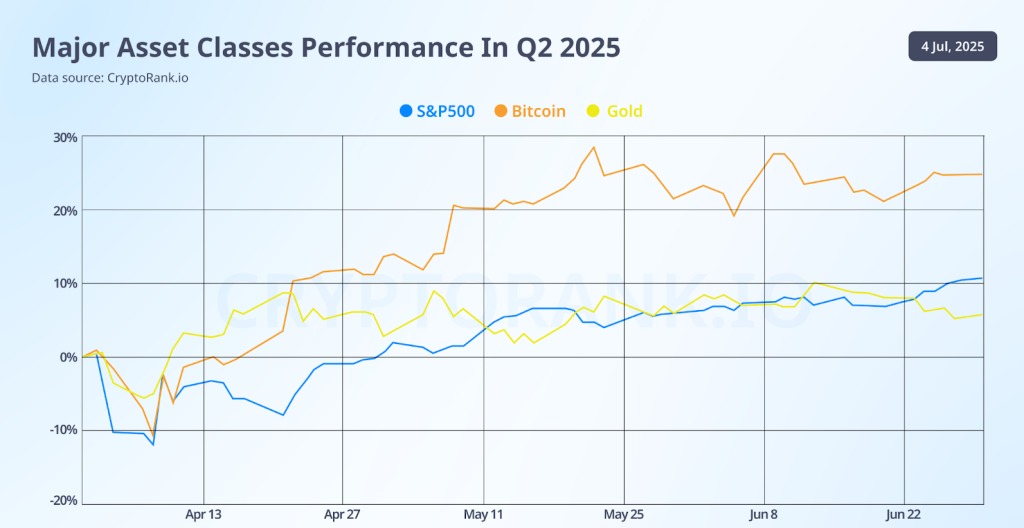
Firstly, Bitcoin is demonstrating strong dominance with a price level of $112-118K, capturing 62-65% of the total market capitalization. This marks the highest level of dominance in the current cycle and signals that investors still place strong confidence in the largest crypto asset.
Secondly, altcoins (alternative cryptocurrencies) are showing unprecedented fundamental strength, particularly in the DeFi (decentralized finance) sector. This creates an intriguing paradox: while Bitcoin leads in price dominance, altcoins are advancing technologically and in practical applications.
Lastly, we are approaching a critical turning point that could trigger “altcoin season” – a period when altcoins outperform Bitcoin significantly.
Bitcoin Dominates Institutional Capital
Bitcoin is currently trading between $112 – 118K, only having recently pulled back about 2% from its all-time high of over $122,000 reached earlier on July 14, 2025. What’s particularly noteworthy this cycle is the shift in driving forces behind Bitcoin’s growth.
Unlike previous cycles driven by retail speculation, this one is powered by institutional capital via ETF products. A prime example is BlackRock’s IBIT ETF, now managing over $75 billion in assets and generating roughly $187.2 million in annual fees.
Important Structural Changes
A significant metric is that 72% of Bitcoin’s supply is now illiquid. This means the majority of Bitcoin is being held long-term by institutions and large investors, not being sold into the market regularly.
Long-term holders currently control over 14 million BTC (approximately 70% of circulating supply). Importantly, they have executed partial distribution twice in this cycle without causing major price corrections like in previous cycles, demonstrating that the market has matured significantly.
Technically, Bitcoin has broken above the previous resistance zone of $110K–$112K, now consolidating around the $117K–$120K range. Both the 50-day and 200-day moving averages are trending upward, indicating a sustained bullish trend. The Relative Strength Index (RSI) sits at 49.73, showing neutral momentum. Support levels have shifted upward, now likely around $115K and $112K, with $110K acting as a stronger support floor due to prior resistance-turned-support behavior.
Ethereum Price Challenges Despite Fundamental Strength
Ethereum is currently trading around $3,232, marking a significant rebound from its recent lows near $2,660. This represents a strong uptrend over the past week, invalidating the prior bearish range of $2,386–$2,596. While the price action appears bearish, on-chain data reveals that Ethereum remains a fundamental powerhouse, especially within the DeFi ecosystem.
To understand this better, we need to distinguish between price performance and ecosystem health. Although ETH price has declined, applications and services on the Ethereum network are actually developing robustly.
Dominance in DeFi
Ethereum continues to lead DeFi with a TVL of $62-68 billion, representing 53% of the global market. This dominance is underpinned by the strength of several flagship protocols that define the Ethereum ecosystem:
- Lido, the leading liquid staking protocol, manages $23 billion TVL. Liquid staking allows users to stake ETH to earn yield while maintaining liquidity.
- Aave, the decentralized lending platform, controls $19 billion and captures 21% of the DeFi lending market. Users can lend and borrow assets without going through traditional banks.
- EigenLayer, the innovative restaking protocol, holds $15.1 billion. Restaking allows users to use already-staked ETH to secure other services and earn additional rewards.
Significant Technical Improvements
Technical upgrades continue to reinforce Ethereum’s infrastructure. The recent Dencun upgrade significantly reduced gas fees on Layer-2 networks, with average gas prices dropping to just 0.859 gwei.
The upcoming Pectra upgrade is expected to improve validator performance and energy efficiency. Ethereum’s Market Value to Realized Value (MVRV) ratio stands at 0.87, suggesting potential undervaluation. This is the lowest level since December 2022, historically seen as a market bottom.
Solana: Explosive Growth Amid Price Weakness
An Interesting Paradox
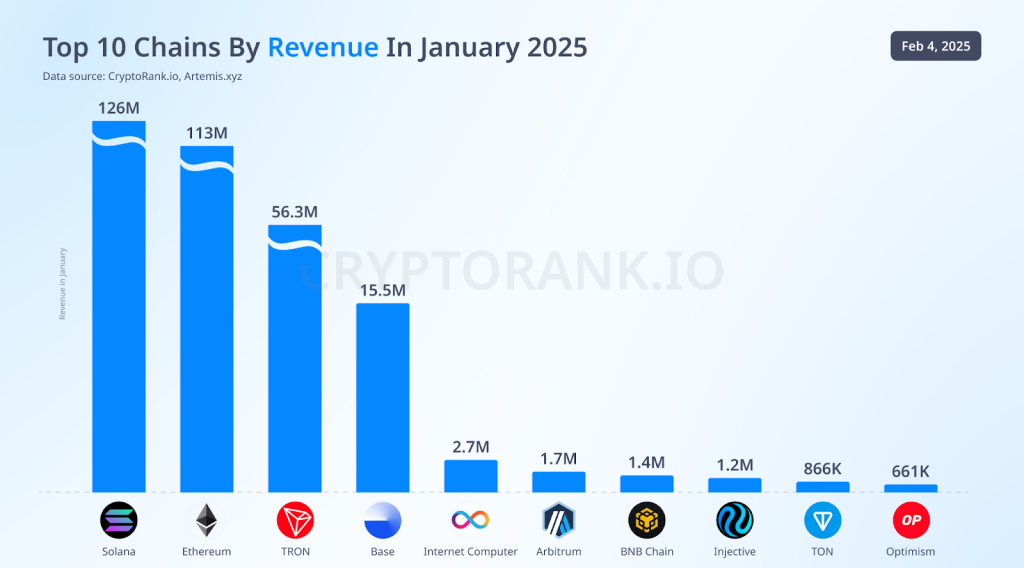
Despite a year-to-date price decline of 10%, with SOL trading at $154 – $167, Solana’s on-chain growth is nothing short of remarkable. This disconnect between price and ecosystem health underscores Solana’s long-term potential.
Explosive DeFi Growth
Solana’s DeFi ecosystem has experienced impressive 2000% TVL growth in 2024, surging from $1.4 billion to $8.6-10.9 billion. This helps Solana become the second-largest DeFi ecosystem globally, behind only Ethereum.
Leading protocols on Solana demonstrate strong attraction:
- Jupiter: $2.5 billion TVL; 82% of Solana’s perpetual volume.
- Raydium: $2.1 billion, strong AMM presence.
- Jito: $2–$3 billion in liquid staking assets.
Superior Technical Advantages
Solana also benefits from technical advantages. It has a theoretical throughput of 65,000 transactions per second with transaction finality under two seconds. Besides, transaction fees remain extremely low, under $0.01. The network processes over 100 million transactions daily and sees 2.2 million daily active wallets during peak usage.
Thus, developer interest has surged as well, with 7,625 new developers joining in 2024—an 83% year-over-year increase, surpassing Ethereum. Solana now supports over 10,000 decentralized applications spanning DeFi, gaming, and consumer sectors.
Market Sentiment and Structural Changes
Fear and Greed Index
The Fear & Greed Index is currently at 71, showing greed sentiment persisting in the market. However, this cycle has different characteristics compared to previous cycles.
Instead of being driven primarily by retail speculation like previous cycles, the current market is shaped by institutional capital flows and broader crypto adoption.
Changes in Holder Behavior
An important structural change is the behavior of Long-term Holders (LTH). They have executed distribution (partial selling) twice in this cycle (March 2024 and November 2024-April 2025) without causing major market corrections.
This differs from historical patterns, where LTH distribution typically marked cycle peaks and the beginning of price decline phases.
Illiquid Supply
The illiquid supply ratio reached a record 78%, with liquid supply compressed to just 1.3 million BTC. This creates potential for “supply shocks” – when slight increases in demand can trigger significant price increases due to supply scarcity.
Altcoin Season Indicators
Altcoin Season Concept
“Altcoin season” is the period when altcoins outperform Bitcoin. The Altcoin Season Index is currently at 16-22, indicating we are still in “Bitcoin Season.”
However, many factors are converging to suggest this could change significantly by the end of 2025.
Bitcoin Dominance Pattern
Bitcoin dominance currently at 64-65% is approaching the upper resistance of the multi-year ascending channel near 65.8%. Historical patterns show altcoin seasons typically begin when dominance peaks at 60-70% and then declines sharply.
In the 2017-2018 cycle, dominance fell from 86% to 38%. The 2020-2021 cycle saw a decline from 70% to 38%.
Timing Analysis
We are currently 273 days after the Bitcoin halving event (April 2024), approaching the historical trigger point of 300+ days for altcoin season. Previous cycles show major altcoin rallies typically begin 6-12 months after halving.
Sector Opportunities
Sector analysis reveals several leading areas:
- Gaming tokens like FLOKI, VIRTUAL, and SAND are showing the best performance.
- DeFi protocols are benefiting from institutional adoption trends.
- Competing Layer-1 blockchains like TON are showing strength due to Telegram integration.
Conclusion
The crypto market in mid-2025 is at a critical turning point. The convergence of institutional adoption, breakthrough technical development, and cyclical patterns creates diverse investment opportunities for the next 12-18 months.
Bitcoin continues to lead with the backing of institutional capital. Ethereum appears poised for recovery, supported by its strong position in the DeFi space. Solana, with its exceptional growth metrics and technical advantages, shows the highest upside potential.
Success in this market phase requires a nuanced understanding of structural shifts, informed on-chain analysis, and smart risk management. Investors who position early and wisely are likely to capture significant returns in the next phase of the crypto.
