
Crypto Recap (Aug 20-29, 2025): Volatility & ETH Surge
A Week of Sharp Swings and Resilient Flows
The cryptocurrency market during August 20-28, 2025, was a rollercoaster of volatility, with flash crashes, institutional inflows, and mixed signals across major assets. Bitcoin (BTC) dipped to as low as $108,500 before rebounding to hover around $111,000-$113,000, reflecting a 2.8% weekly decline but showing signs of stabilization. Ethereum (ETH) outperformed, surging briefly to a new all-time high near $4,945 before pulling back to $4,600, up about 4.89% amid strong ETF demand. The total market capitalization dipped below $3.9 trillion at one point due to a $130 billion wipeout but recovered to $3.91 trillion by week’s end, with 24-hour trading volume at $173.37 billion. Key themes included a Bitcoin whale dumping 24,000 BTC, triggering a $4,000 flash crash in BTC and broader liquidations totaling $200 billion, while Ethereum’s resilience highlighted shifting investor preferences.
Paradoxically, macroeconomic dovishness from Fed Chair Jerome Powell at Jackson Hole boosted rate-cut expectations to 87% for September, favoring risk assets like crypto despite labor market softness. This recap explores how volatility exposed overleveraged positions, yet “smart money” inflows and on-chain metrics point to untapped upside, contrasting with the hype of prior weeks.
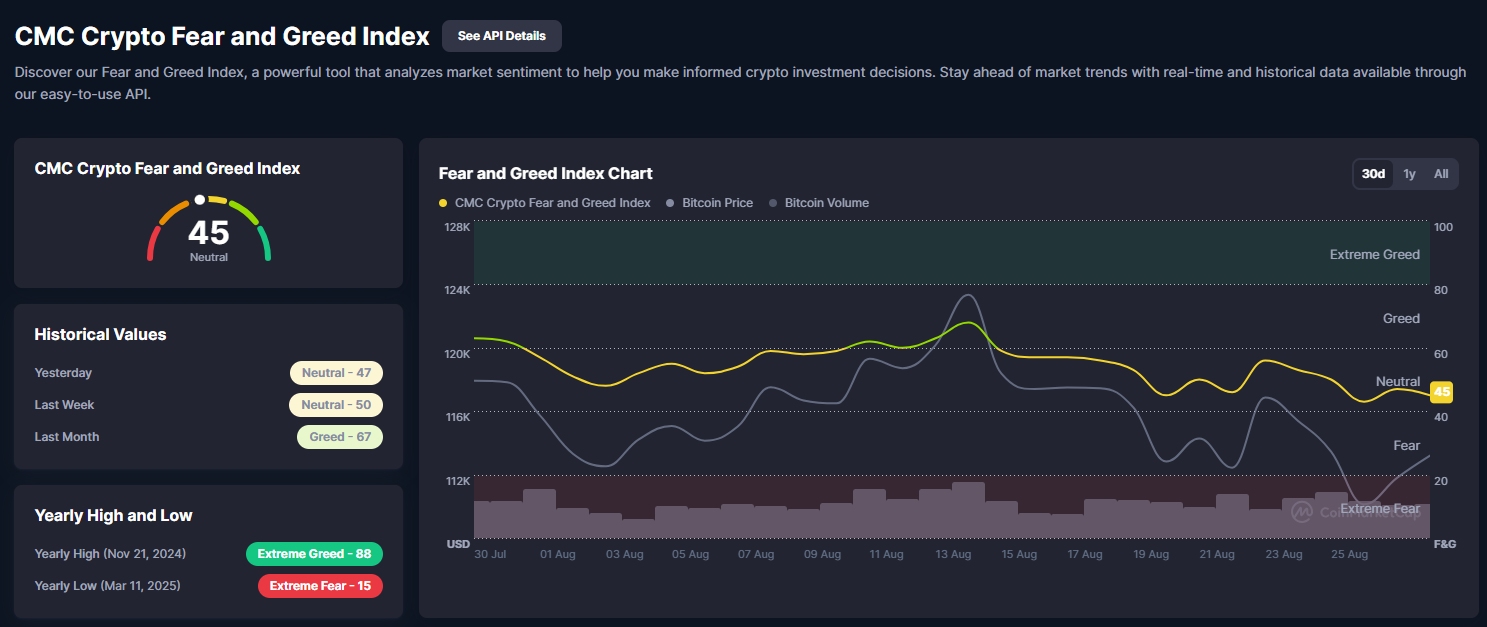
The Fear and Greed Index dropped to 46 (Neutral), down from last month’s Greed at 67, signaling cautious sentiment amid the pullback. The Altcoin Season Index sat at 46/100, firmly in Bitcoin Season but up from 39 last month, hinting at potential rotation if ETH momentum sustains. On-chain indicators like reduced selling pressure and stablecoin TVL growth (USDC projected at 40% annual expansion) underscore crypto’s hedge appeal amid global uncertainties, including U.S. unemployment ticking to 4.2% and tariff escalations on chips and gold. While short-term action was choppy, metrics like NUPL (Net Unrealized Profit/Loss) above 0.5 suggest the market isn’t overheated, positioning for a more sustainable rally.
Analysis of Crypto Total Market Cap and Indices
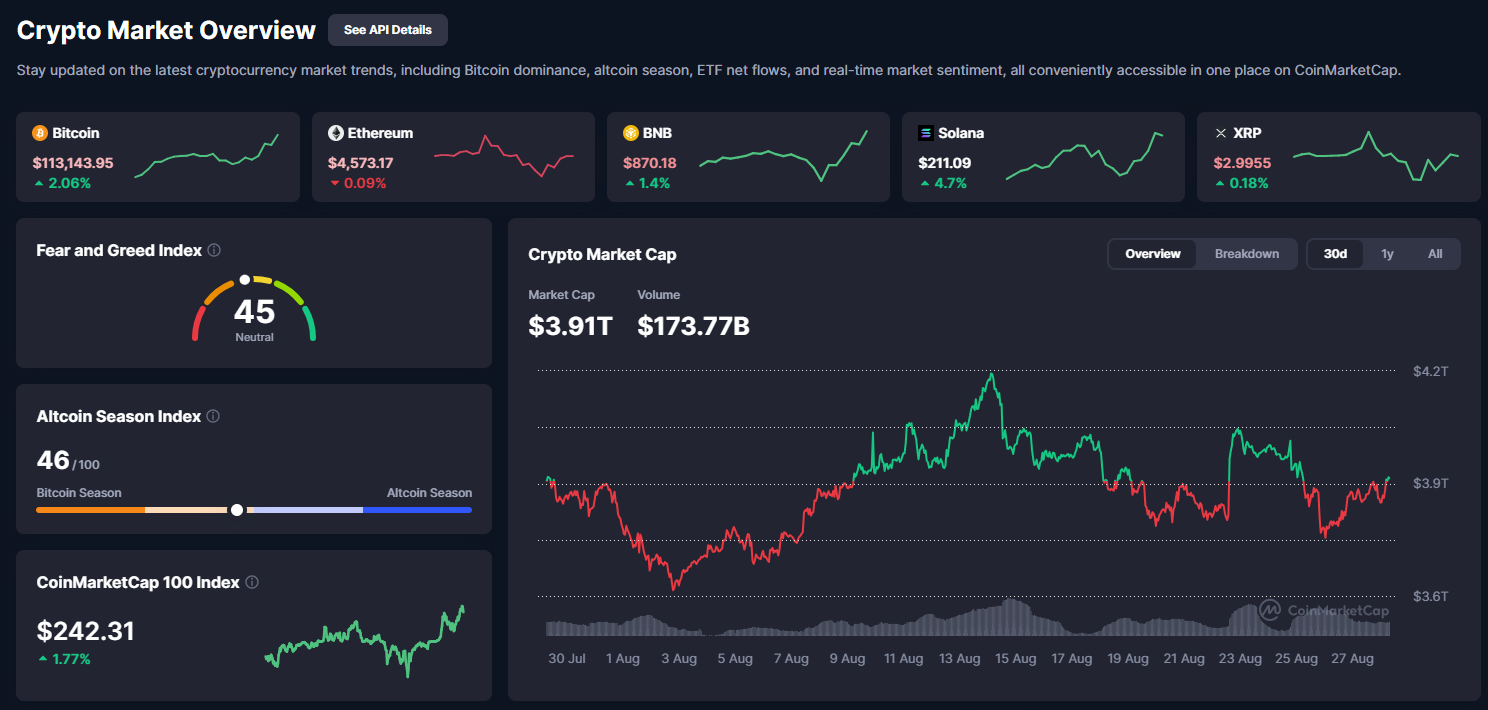
From the CoinMarketCap overview, the total crypto market cap stood at $3.91 trillion, a slight recovery from mid-week lows but still shy of the $4 trillion milestone teased earlier in August. Volume surged to $173.37 billion, driven by liquidation cascades and opportunistic buying. The CoinMarketCap 100 Index rose 1.77% to $242.31, indicating broader altcoin resilience despite BTC dominance at 57.6%. This consolidation phase mirrors a classic post-ATH digestion, with the chart showing a sharp dip after July’s peak, followed by a bounce from support near $3.7 trillion. Decreasing volume during the pullback suggests waning sell pressure, potentially forming a bull pennant if upside breaks $4.1 trillion.
The CMC Crypto Fear and Greed Index at 45 (Neutral) reflects a cooldown from Extreme Greed (88) in late 2024, with historical values showing yesterday at 47, last week at 50, and last month at 67. The chart overlays BTC price and volume, revealing sentiment dipping as BTC volume thinned during the flash crash, but rebounding with Powell’s comments. This neutral zone often precedes volatility expansions, as seen in prior cycles where sub-50 readings marked buying opportunities before year-end rallies.
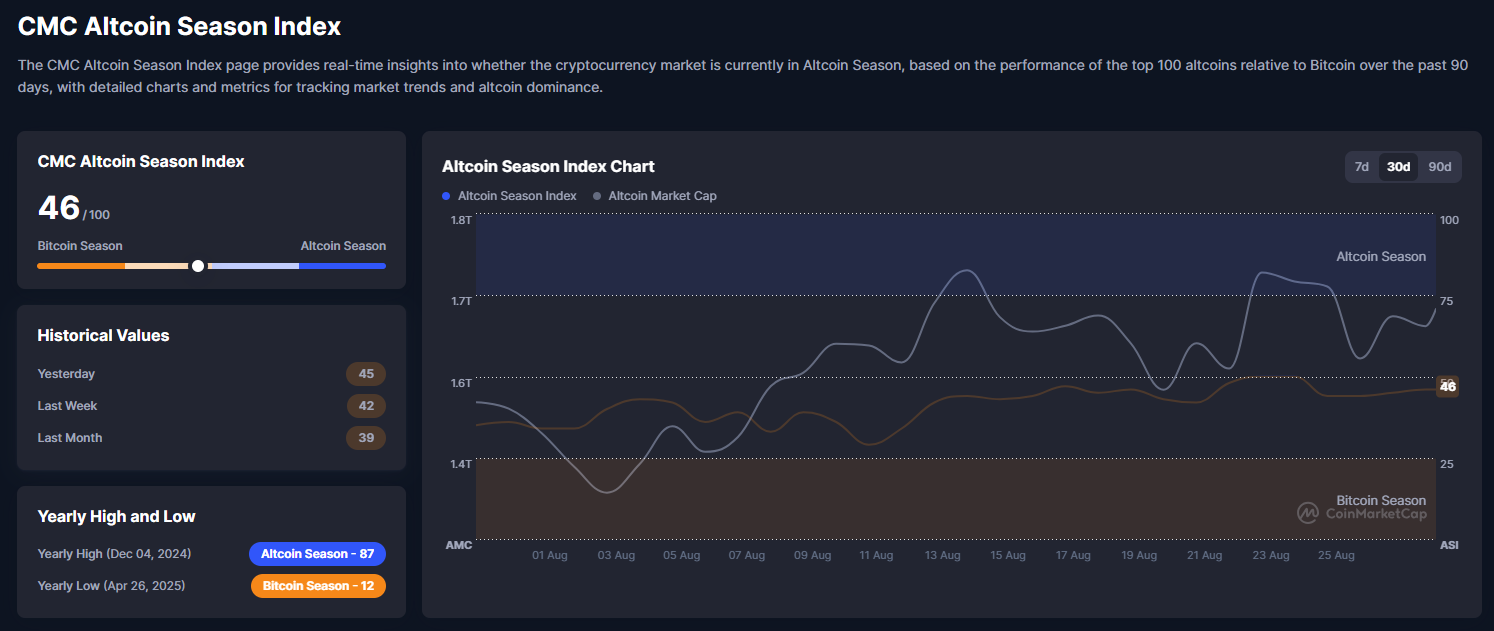
The CMC Altcoin Season Index at 46/100 confirms Bitcoin Season dominance, with the slider in the orange “Bitcoin Season” zone. Historical show yesterday at 45, last week at 42, and last month at 39, indicating gradual improvement. The chart displays altcoin market cap volatility, with recent peaks aligning with ETH’s surge. At 46, we’re bordering a shift—if it crosses 75, alt season could ignite, especially with ETH/BTC ratio climbing to 0.041. This setup echoes 2021, when similar index lows preceded altcoin outperformance.
Technical Analysis and Outlook for Key Tokens
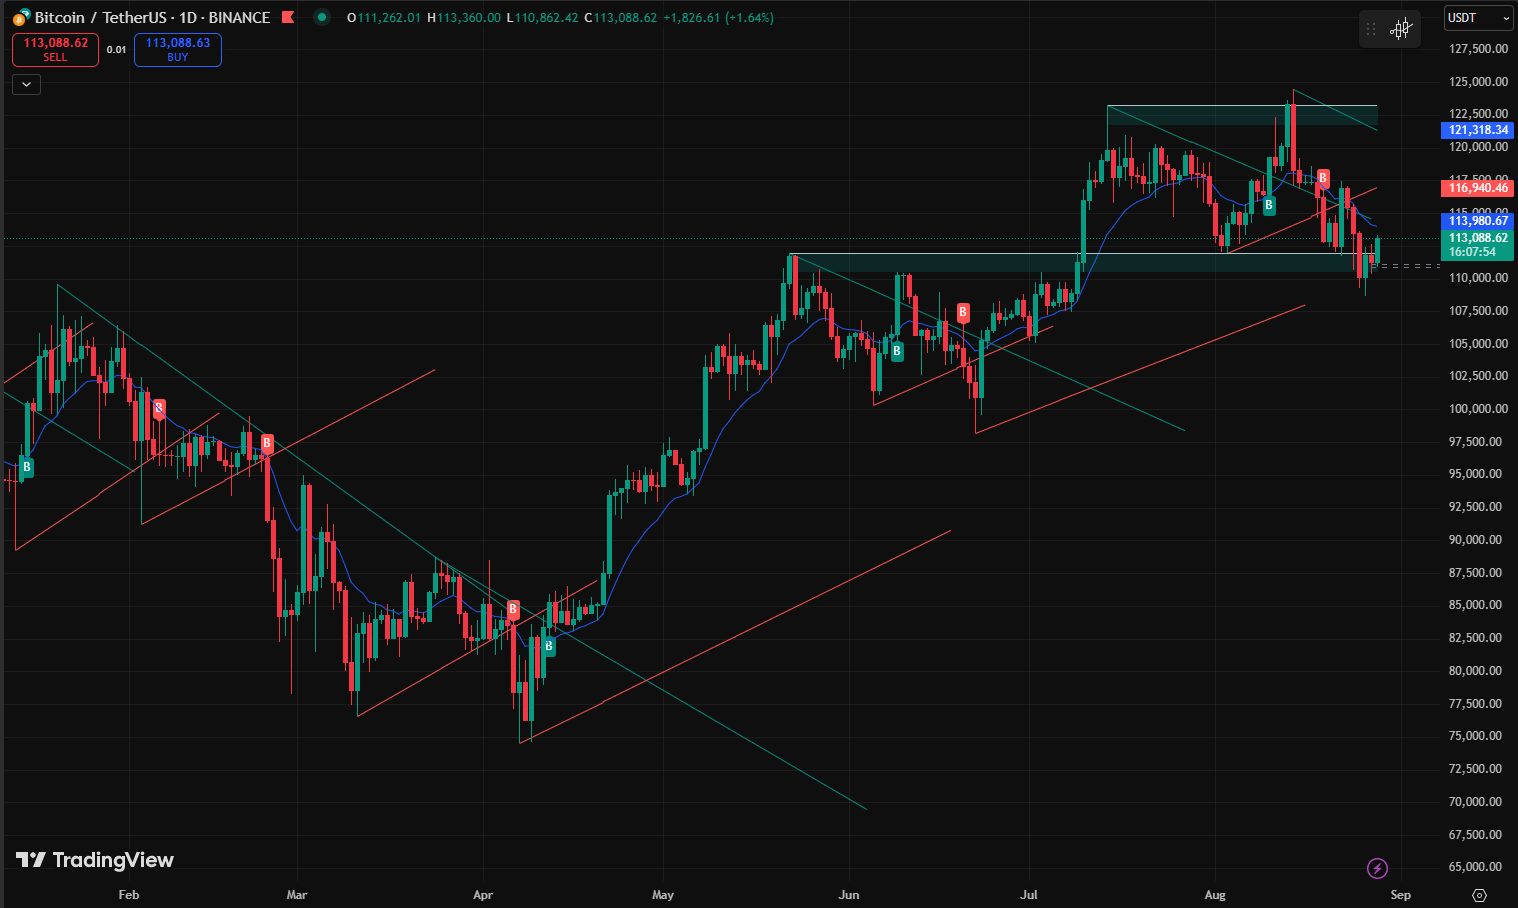
From a technical standpoint, the BTC/USDT daily chart on Binance shows BTC in an ascending channel since February, with support at $108,500 (recent low) and resistance at $113,100 (50-day MA). A descending wedge breakdown mid-week triggered the flash crash, but a bullish divergence on RSI (hovering at 48) and narrowing Bollinger Bands suggest a potential squeeze. Buy signals at supports like $110,000 and a sell near $120,000 from July highlight range-bound action. Possibilities: Uptrend resumption if breaks $113,100, targeting $117,000-$120,000 (CME gap); downtrend if loses $108,500, eyeing $100,000; sideways consolidation likely short-term with high volatility from leverage (OI at $38.8B). Overall, bullish bias holds the channel low.
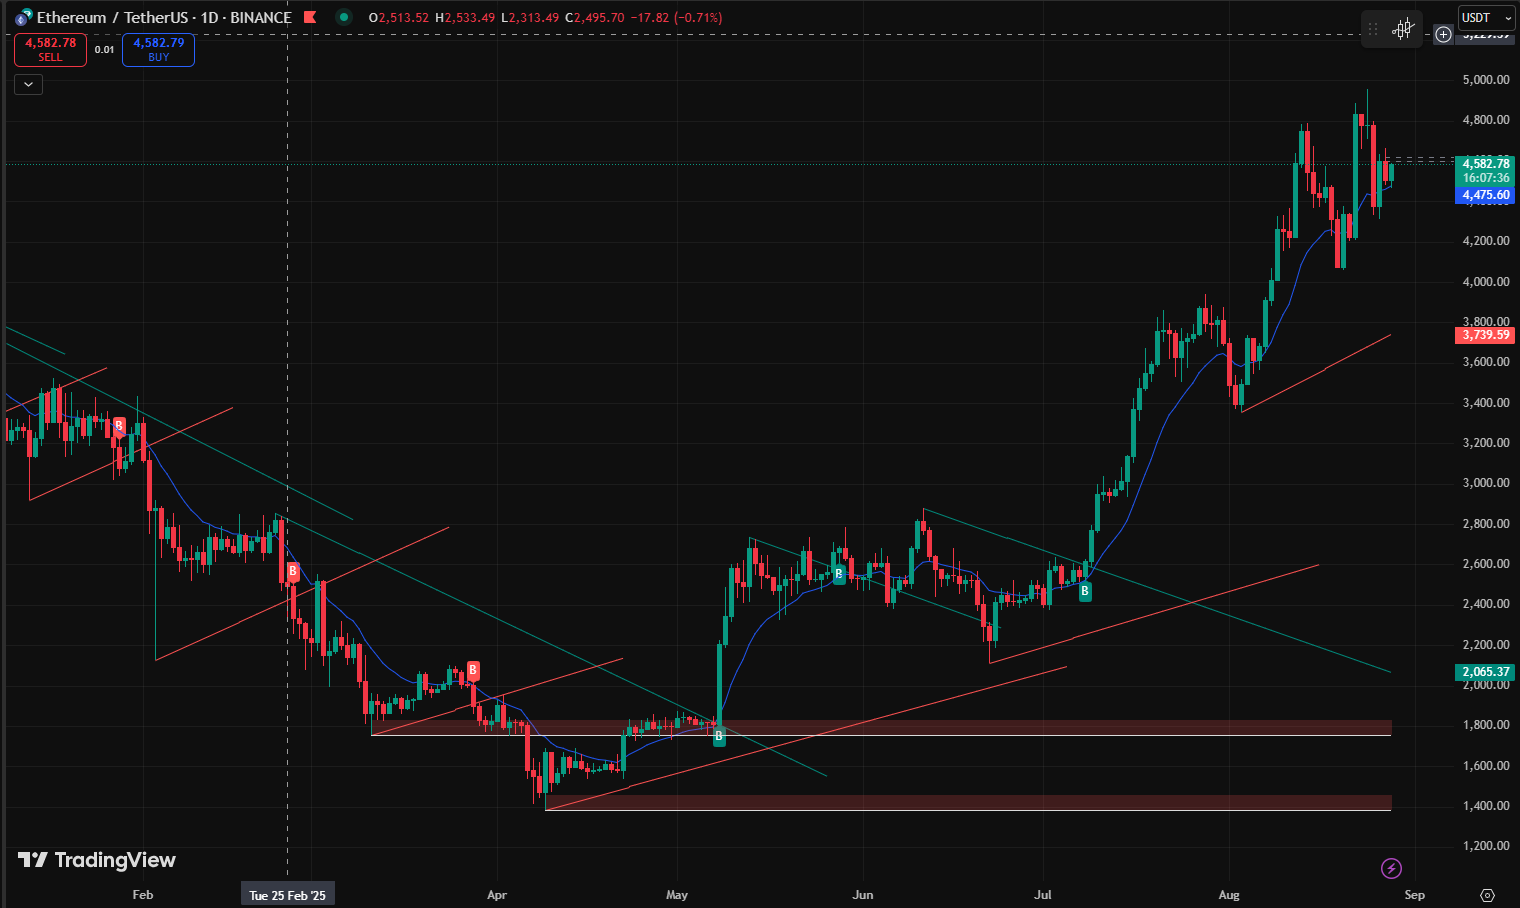
ETH/USD chart reveals a strong uptrend, breaking out of a symmetrical triangle with higher highs/lows. Price at $4,578 (up 1.52%) respects the 50-day MA at $4,470 as support, with RSI at 55 indicating room for gains. Buy signals at $4,200 and resistance at $4,800 (recent high). Scenarios: Uptrend continuation to $5,000-$6,000 if sustained above $4,600, fueled by ETF flows; downtrend if breaks $4,350, testing $4,000; high volatility expected with options signaling ±2% swings; sideways if macro softens. ETH’s outperformance suggests leadership in any rotation.
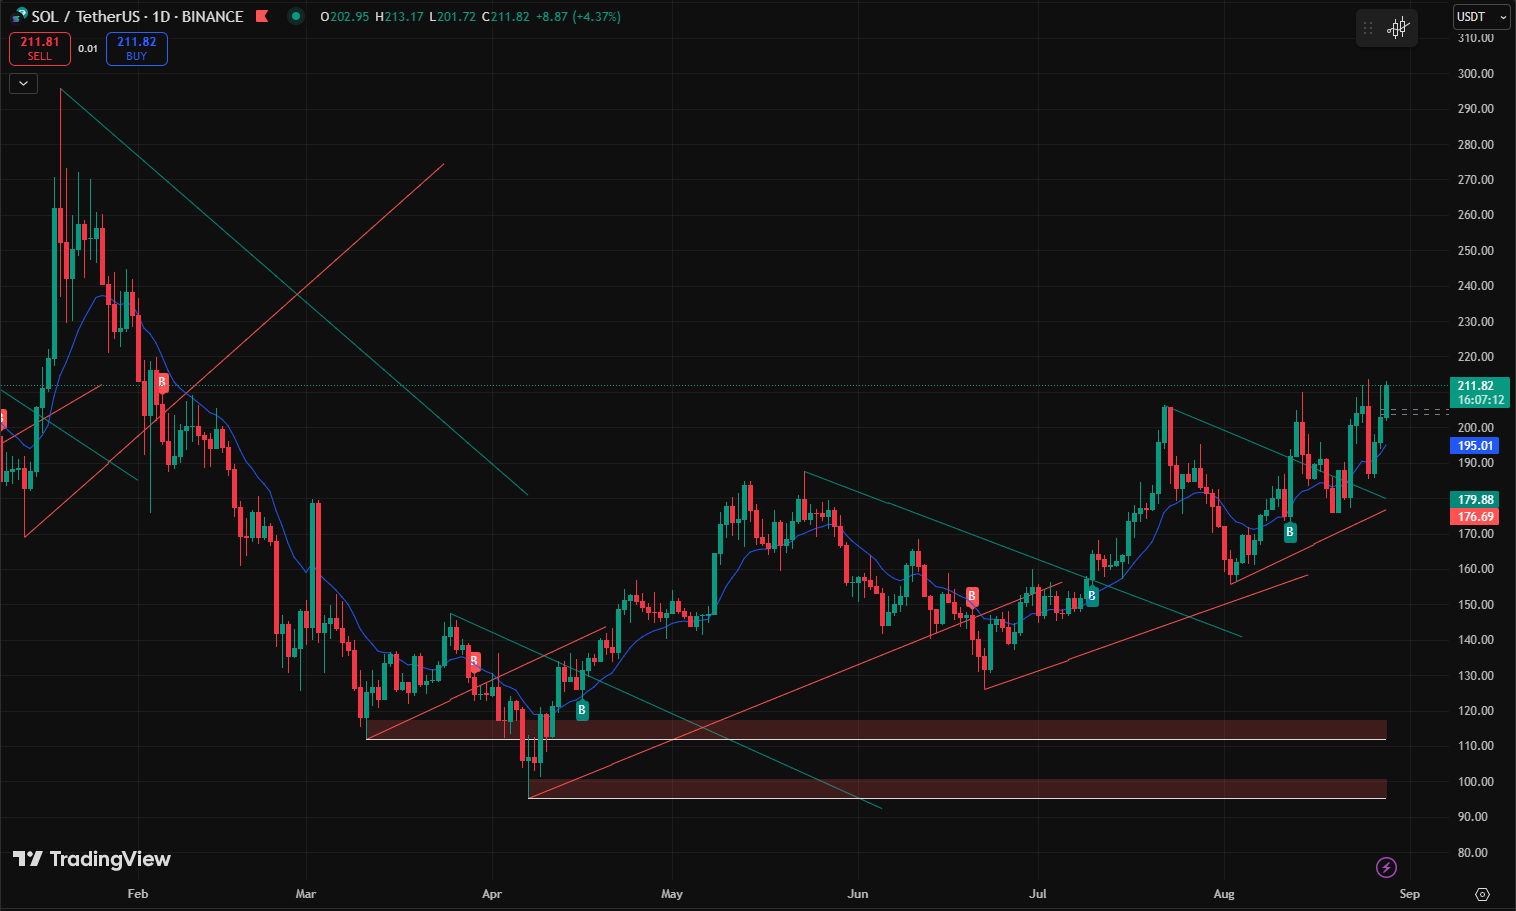
SOL/USDT displays bullish momentum, up 4.34% to $202 in a rising channel, with support at $190 and resistance at $211 (recent high). Multiple buy signals along the trendline, RSI at 62 showing strength without overbought. Outlook: Uptrend to $250 if breaks $211; downtrend below $186 to $170; sideways in $190-$210 range; high volatility from on-chain activity (e.g., pump.fun integrations). SOL’s 4.7% gain amid broader dips signals alt strength.
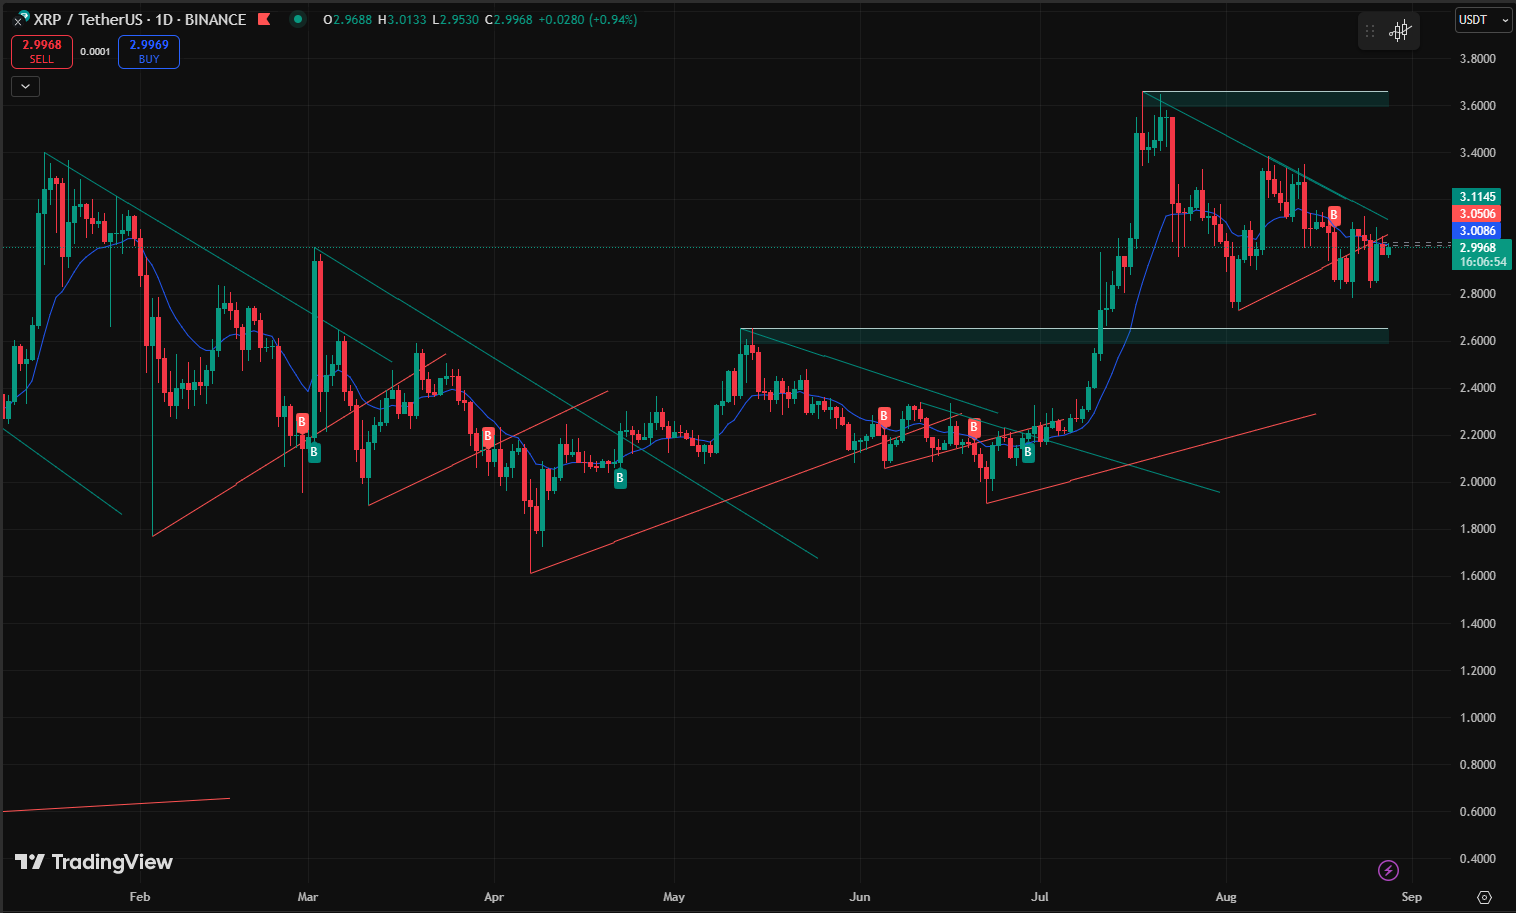
XRP/USDT is sideways, trading at $2.996 (-0.92%) in a tight range, with support at $2.90 and resistance at $3.11. Descending trendline caps upside, RSI at 50 neutral. Possibilities: Uptrend breakout above $3.02 to $3.50; downtrend if it loses $2.90 to $2.50; continued sideways with low volatility unless ETF news catalyzes; regulatory tailwinds could spark move.
Institutional Inflows: ETFs Absorb Pressure
Institutional buying provided a buffer amid volatility. U.S. BTC spot ETFs saw $219 million in net inflows on August 25 after six days of outflows, with Fidelity’s FBTC and BlackRock’s IBIT leading at $15.2 billion combined in Q2. ETH ETFs hit a record $444 million the same day, pushing ETH above $4,900 briefly, dominated by BlackRock’s ETHA at $314.9 million. Pensions and corporates continued stacking: Biotech firms bought BTC to attract investors, while Harvard and others held steady in IBIT. These flows, totaling $1.3 billion weekly for ETH, align with reduced volatility in charts, RSI around 60 signaling entry points.
Macroeconomic Backdrop: Dovish Fed vs. Labor Softness
U.S. data showed unemployment at 4.2%, with jobless claims elevated, raising recession fears but prompting Fed cuts—four 0.25% reductions eyed by year-end. Powell’s Jackson Hole speech softened the dollar (DXY at 97.9), boosting crypto. Tariffs on semiconductors and gold pushed prices up, with Saylor noting BTC as a “digital gold” hedge. BTC bounced from channel support during dips, respecting the 200-day MA near $80,000.
Policy Wins: Trump’s Push and SEC Pivots
Trump signed orders allowing crypto in retirement plans and probing bank discrimination, building on the GENIUS Act for stablecoins. SEC softened on staking, aiding ETH/SOL. Brazil’s BTC reserve hearing loomed, while SWIFT tested XRP for payments.
Ethereum’s Resurgence and Flippening Buzz
ETH climbed to $4,945, narrowing to 2021 ATH. Predictions hit $7,500 by year-end, with ETH/BTC at 0.041 potentially reaching 0.085 ($10,000 ETH). Lubin reiterated flippening within a year. Chainlink’s treasury amassed $1M in LINK; TRON hit $600B in stablecoins.
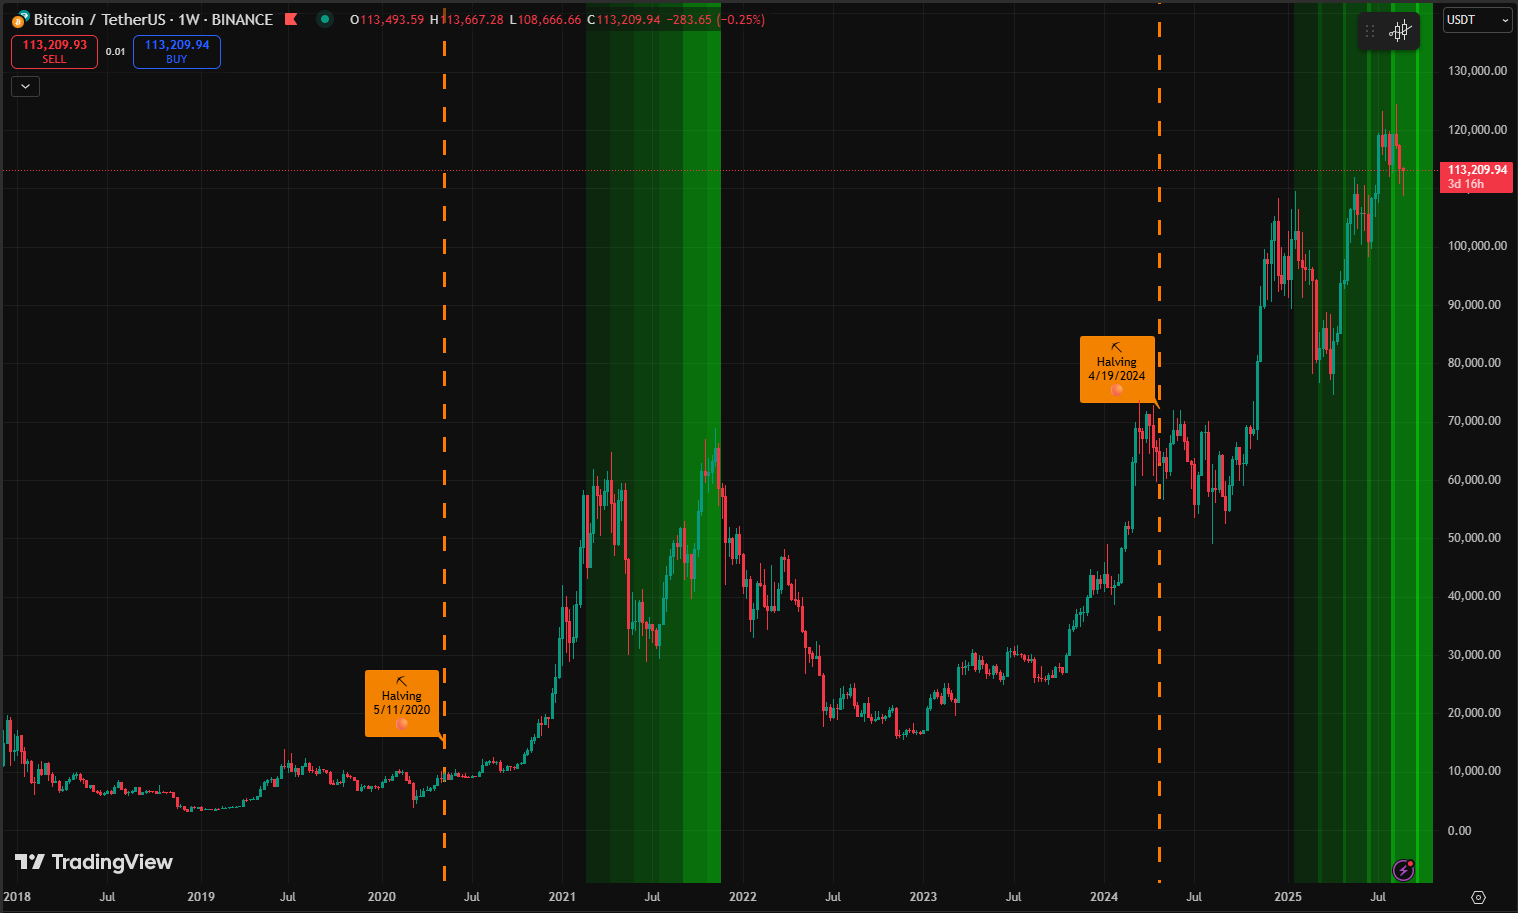
Bitcoin’s 4-Year Cycle: Evolving or Intact?
Debate rages: Hougan says ETFs dampen winters, but polls show 60% believe cycle persists. Chart mirrors post-halving patterns, with potential peak late 2025.
Other News: Coinbase DEX on Base; VanEck Solana ETF proposal.
Conclusion: Building for the Next Leg Up
This week tested nerves with volatility, but inflows, policy tailwinds, and ETH strength lay foundations for growth. BTC may sideways near $113,000, with upside to $120,000 if it holds support; bearish below $108,000. ETH eyes $5,000+, SOL $250, XRP sideways unless catalysts. Ahead: CPI data, Fed speeches. Not explosive, but an accumulation window grounded in fundamentals.