Weekly Crypto Market Recap: Fed’s $29B Pump and Market Shifts
A Week of Macro Liquidity Injections and Sector-Specific Pressures
The weekly crypto market recap for November 3 to 10, 2025 moved through a tense and uncertain week. The Federal Reserve quietly injected 29 billion dollars into the system through reverse repo operations, signaling support for liquidity even as broader markets stayed defensive. Berkshire Hathaway’s record 325 billion dollars in cash showed that major investors were still preparing for turbulence rather than chasing risk.
AI-related stocks continued to fall, adding pressure to sentiment, while traders waited for the Supreme Court’s decision on upcoming crypto taxation cases. Together, these forces created a cautious tone that weighed on risk appetite despite fresh liquidity entering the market.
The total value of all cryptocurrencies slipped from 3.61 trillion to 3.57 trillion dollars, marking a weekly decline of about one percent. Stronger-than-expected job numbers briefly lifted confidence, but persistent inflation worries and slower corporate Bitcoin accumulation quickly erased those gains.
- Bitcoin (BTC) fell to 105,890.48 dollars (4.1% daily, 5.2% weekly) after dipping below 100,000 for a short time as fear resurfaced.
- Ethereum (ETH) ended at 3,628.87 dollars (4.09% daily, 5.8% weekly), holding steady within its broader uptrend.
- Solana (SOL) closed at 172.74 dollars (5.01% daily, 6.5% weekly) as investors continued to take profits.
- XRP traded near 2.4359 dollars (3.17% daily, 4.2% weekly), showing slightly stronger stability than peers.
- BNB finished at 1,039.26 dollars (4.78% daily, 3.6% weekly), supported by steady ecosystem growth that helped absorb some of the pressure.
Average daily trading volume held around 127 billion dollars, reflecting a market still dominated by caution. The Fear and Greed Index dropped to 36, down from 42 the previous week, as sentiment weakened after the Fed’s cautious tone and a wave of AI-sector layoffs including 30,000 job cuts at Amazon and nearly half of Chegg’s workforce.
Across the week, several themes shaped the narrative. The Fed was quietly adding liquidity while Berkshire was sitting on record cash. U.S. markets slowed during election week, AI stocks continued to retreat, and investors kept watch on pending crypto tax rulings. Meanwhile, industry headlines showed steady progress. IBM introduced its Digital Asset Haven project, Citi partnered with Coinbase on a stablecoin initiative, and Western Union began testing blockchain technology for global payments.
Regulatory and institutional developments also stood out. Japan’s JPYC received full approval from the Financial Services Agency. Larry Fink of BlackRock again pointed to Bitcoin and gold as long-term hedges against inflation. MicroStrategy expanded its holdings to more than 640,000 BTC. On-chain data stayed consistent with the stablecoin supply near 300 billion dollars and DeFi’s total value locked around 42 billion. Roughly 3.2 billion dollars in token unlocks created mild selling pressure but did not disrupt overall stability.
Outside of price action, broader shifts defined the backdrop. Layoffs in the AI industry reminded investors that the tech downturn is still unfolding. Stablecoins kept gaining ground in traditional finance. In Asia, the United States agreed to reduce tariffs on Vietnamese electronics and signed new trade deals with Cambodia, Malaysia, and Thailand covering rare earths and agriculture.
Despite the cautious tone, analysts from FxPro and Crypto.news maintained their long-term Bitcoin target around 130,000 dollars. They noted that the market’s foundation remains intact and that clarity from the Fed on liquidity and trade could quickly restore confidence in the weeks ahead.
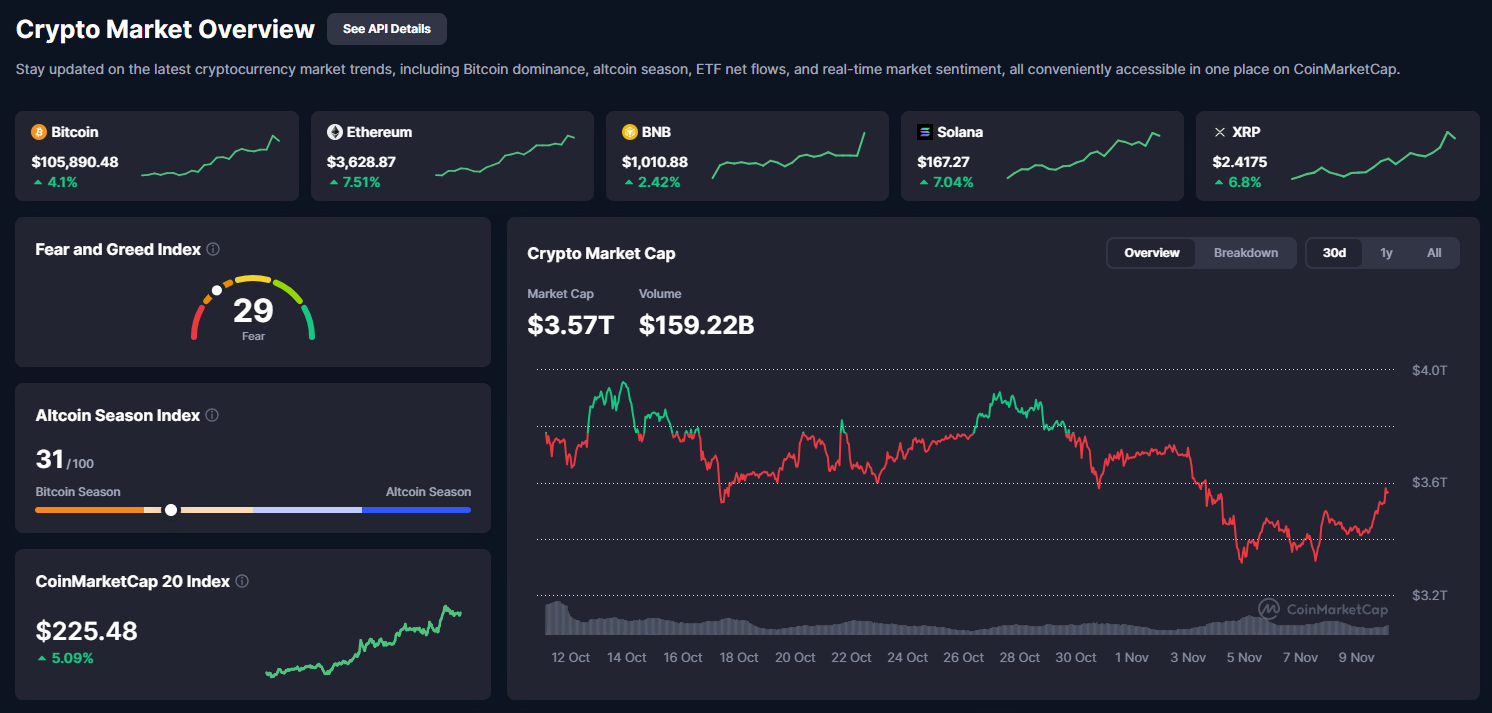
From the CoinMarketCap overview (Image 1: Crypto Market Overview dashboard displaying total cap at $3.57T, volume $159.22B, Fear & Greed at 29, Altcoin Season Index at 31, and CoinMarketCap 20 Index at $225.48 -2.81%), the decline is evident: cap line trends downward from late-October levels, with volume spikes on sell-offs.
Analysis of Crypto Total Market Cap and Indices
The CoinMarketCap overview (Image 1: dashboard highlighting a total market capitalization of 3.57 trillion dollars, up 0.34% daily, with top tokens including BTC 4.1%, ETH 7.51%, BNB 2.42%, SOL 7.04%, and XRP 6.8%) shows that the market remained weak overall. The total cap fell from 3.7 trillion dollars, erasing most of the late October gains.
Trading volume stood at 159.22 billion dollars, down 12% from the previous week, a clear sign that investors stayed cautious. Bitcoin’s dominance rose to 57.5%, leaving 42.5% for altcoins as traders favored larger, more stable assets in a risk-off environment.
The 30-day chart continued to show a steady decline that began in mid-October, now testing the 50-day moving average at 3.65 trillion dollars, a pattern similar to bear market conditions seen in 2022.
Historically, October delivers an average gain of about 28%, but this year the rally failed to appear. Trading volume data confirmed strong selling pressure across most major tokens. Ethereum’s market share contracted to 17%, Solana slipped by 3%, and XRP remained mostly flat at 1.2%.
While the Federal Reserve’s hawkish tone remains a key risk, recent progress in global trade deals continues to provide some support for broader market sentiment.
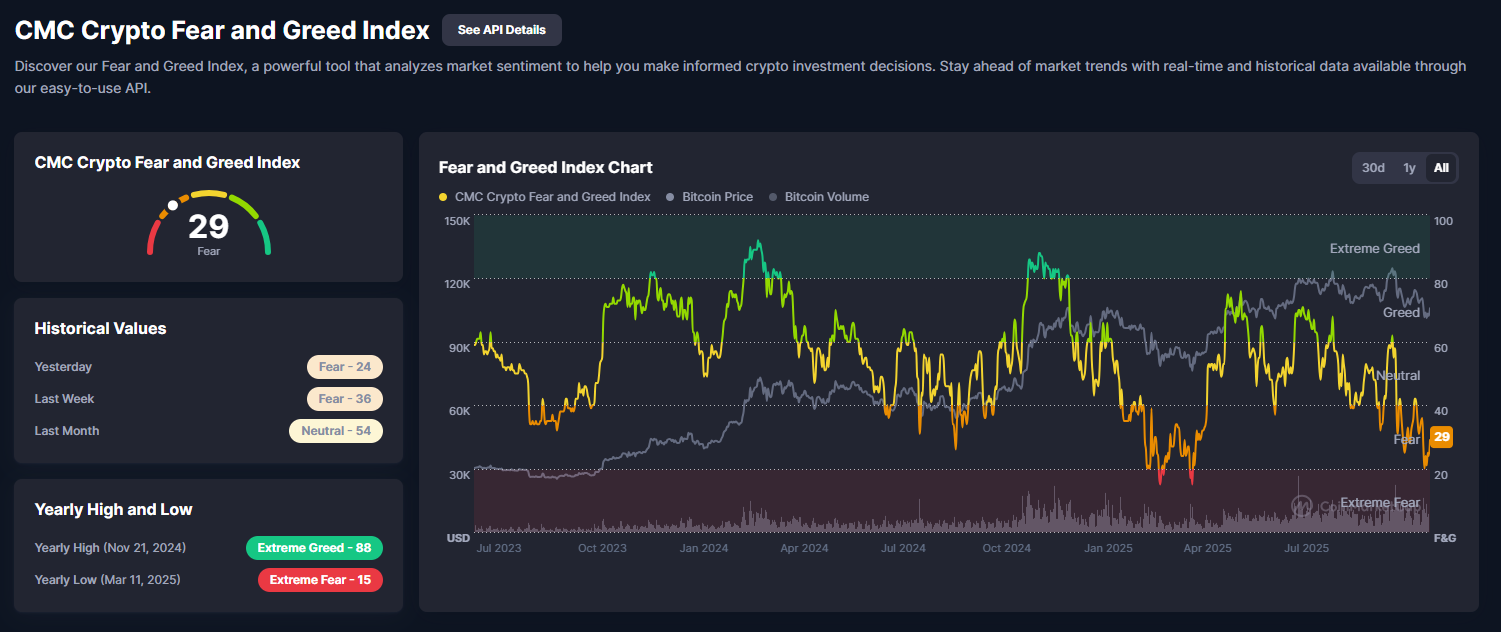
The CMC Crypto Fear and Greed Index at 29 (Fear) (Image 2: Fear and Greed Index chart with current 29, historical: yesterday 24, last week 36, last month 54) captures sentiment drop, BTC overlay downtrends. Yesterday’s 35, last week’s 42, month’s 57 show volatility. Yearly highs 88 lows 15 frame fear as buy signal, components volatility +15%, social -10%. Past Fear Octobers +20% moves.
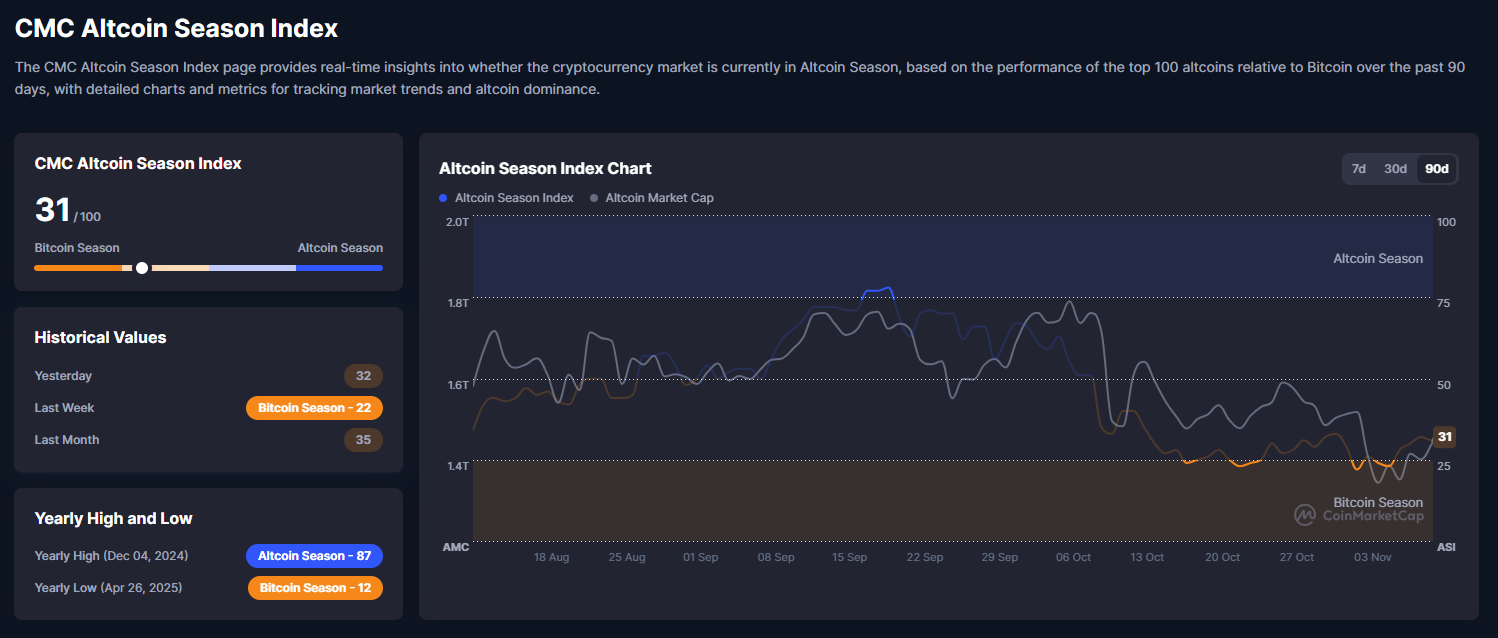
The CMC Altcoin Season Index at 31/100 (Image 3: Altcoin Season Index chart at 31, historical: yesterday 32, last week 22, last month 35) signals Bitcoin season dominance, down from last week 40, month 50. Alt cap contracts, historical lows often precede rebounds if BTC tops.
Technical Analysis and Outlook for Key Tokens
The technical outlook for the cryptocurrency market as of November 3, 2025, combines three perspectives: price action and indicators from technical analysis, on-chain and project data from fundamentals, and macroeconomic context such as global events and policy changes. Together, these elements provide a complete picture of the current state of major assets including BTC, ETH, SOL, and XRP.
Market sentiment remains cautious, with the Fear and Greed Index at 36, reflecting growing unease over the Federal Reserve’s hawkish stance and ongoing trade uncertainty. The Altcoin Season Index at 26 shows that Bitcoin continues to dominate market flows, suggesting that a broad rotation into altcoins is unlikely until conditions stabilize.
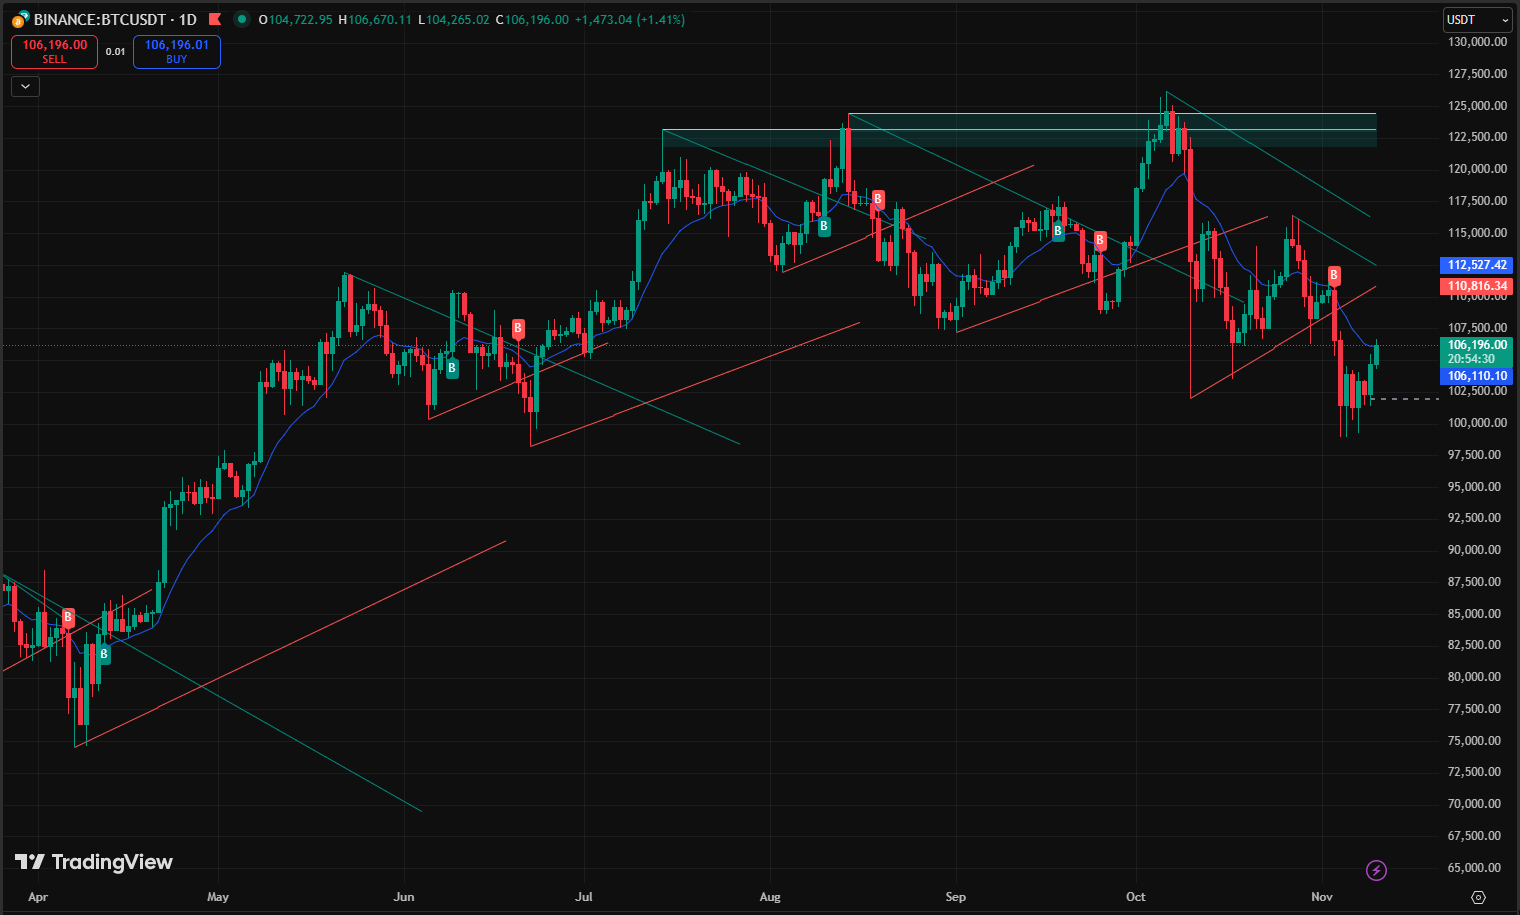
Bitcoin (BTC)
Current Price: 106,196 dollars
Chart Context (Daily)
Bitcoin continues to move inside a clear ascending channel that has held since the February 2025 lows. The recent pullback tested support around 104,000 dollars, a level that has been defended multiple times. Higher lows from the 96,000 region confirm that the broader uptrend remains intact.
Technical Breakdown
Key Levels
- Support: 104,000 dollars — tested and proven as a strong psychological and structural area.
- Resistance: 110,000 dollars — the 50-day moving average and the next breakout threshold.
Pattern
A descending wedge is forming after the tariff announcement, with converging support and resistance lines. This pattern often precedes a bullish breakout if volume confirms.
Price Action
Recent rebounds near 106,000 have marked buy zones, while short-term peaks are viewed as profit-taking points. Volume on rebounds has been fading, which signals caution among traders despite the price recovery.
Indicators
- RSI (46): Oversold divergence, an early sign of possible reversal or consolidation after a sharp decline.
- Bollinger Bands: Tight range, showing low volatility and setup for an expansion. Similar squeezes in 2021 preceded 30% moves.
- MACD: Negative but improving, suggesting fading bearish momentum.
Fundamental Snapshot
- ETF flows: Net outflows of 470.7 million dollars, reflecting short-term profit-taking by institutions.
- Long-Term Holders (73%): A strong signal of confidence and reduced selling pressure.
- Miners: Accumulating at four times the usual rate, indicating conviction.
- Corporate activity: Metaplanet’s 632 million dollar Bitcoin purchase highlights continued institutional interest.
Macroeconomic Context
The Fed’s recent hawkish tone has softened, shifting market expectations by about 6.5% for the week. Any clear dovish signal could revive risk appetite. Trade deal progress is helping reduce uncertainty, and the weaker U.S. dollar is supporting Bitcoin’s role as a store of value. Gold prices around 3,930–4,020 dollars show that investors are still seeking inflation hedges.
Scenario Outlook
Bullish Case
- Break above 110,000 with strong volume.
- Potential targets at 114,000 and 118,000 dollars.
- Historically, similar setups after Fed pivots produced 35% gains when NUPL reached 0.5, which is the current level.
Bearish Case
- A drop below 104,000 could trigger a move toward 100,000 dollars.
- Open interest at 39 billion suggests risk of liquidation if support fails.
Sideways Case
- Range between 104,000 and 110,000 dollars until a new catalyst emerges.
- Consolidation is likely, suitable for accumulation positions.
Volatility Events
Major Fed decisions, trade developments, or macro shocks could cause quick 10% swings. Tight risk management remains essential.
Bias and Valuation
The overall bias is neutral. The technical structure remains bullish, but resistance at 110,000 and weakening volume justify caution. The MVRV ratio of 2.5 shows fair valuation, with no sign of panic or euphoria.
Strategy
Bitcoin is approaching a decision point. The long-term structure and strong holder base provide support, but the 50-day moving average at 110,000 is still the key barrier. If that level breaks with volume, the next rally could be significant.
Action Plan
- Conservative traders: Wait for a confirmed daily close above 110,000 before entering.
- Aggressive traders: Accumulate between 104,000 and 106,000 with stops below 103,500.
- Risk focus: Monitor Fed commentary and ETF flows closely, as they remain key short-term drivers.
If buyers reclaim the 50-day average, momentum could accelerate quickly. If not, expect more consolidation before the next move.
Ethereum (ETH)
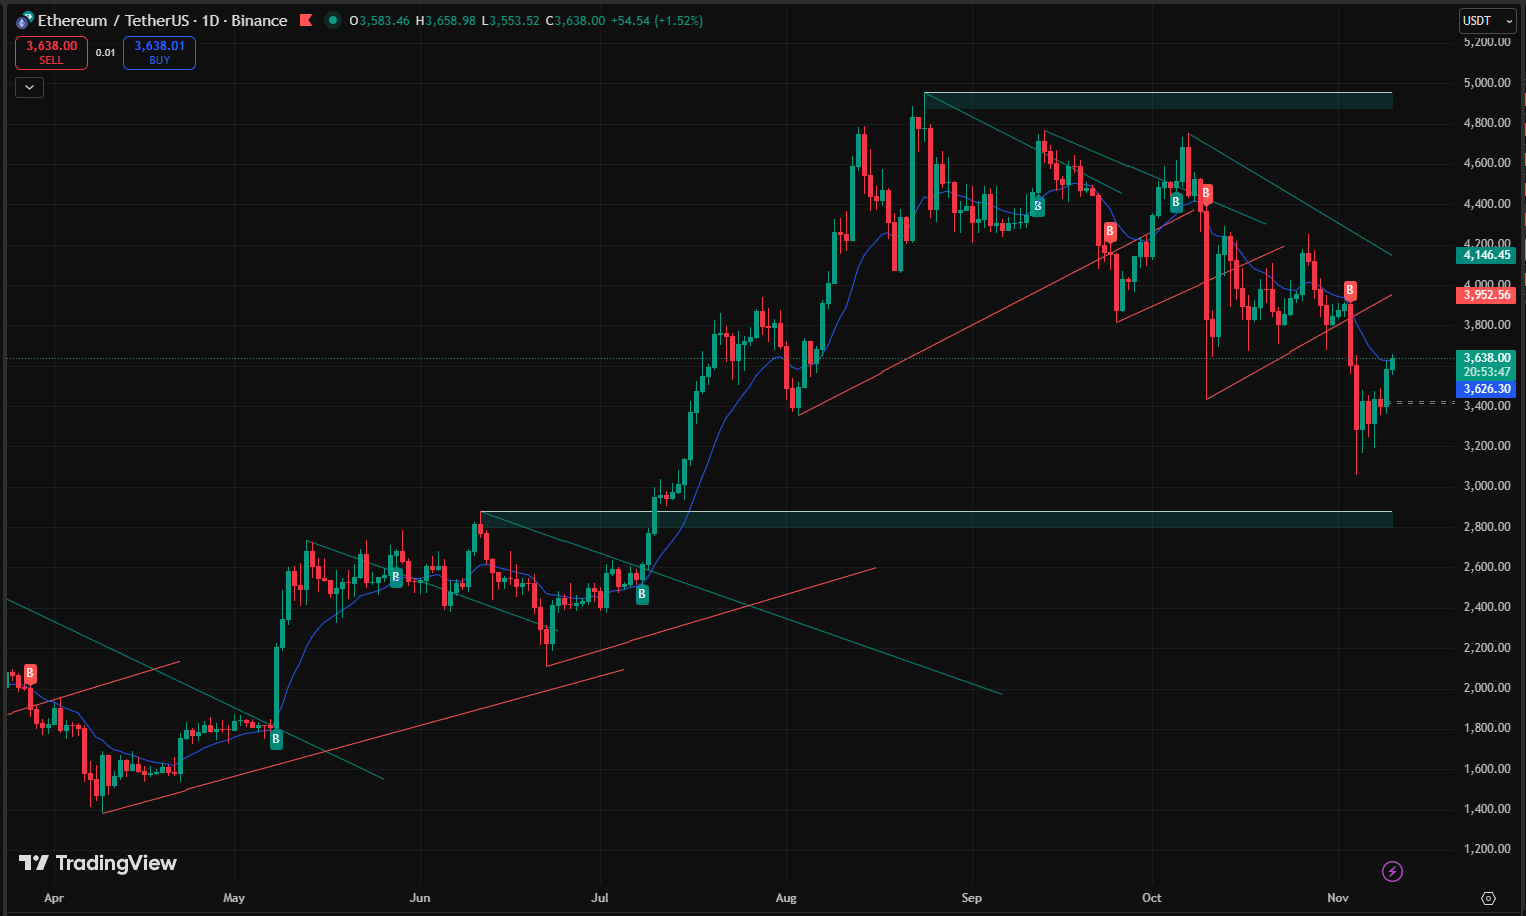
Chart Context (Daily)
Ethereum is consolidating within a rising channel that has been forming since the first half of 2025. The recent pullback created a falling wedge pattern, which is often a bullish continuation signal. Price tested key support near 3,600 dollars and held firmly, confirming that the broader uptrend structure remains intact.
Technical Breakdown
Key Levels
- Support: 3,600 dollars — tested and confirmed as a strong psychological and structural zone.
- Resistance: 3,800 dollars — the 50-day moving average and the immediate barrier to break.
Pattern
A falling wedge with converging trendlines is visible. A breakout above the upper boundary could trigger a sharp rally if supported by higher volume.
Price Action
Recent rebounds near 3,700 have marked short-term buy zones, while peaks have acted as resistance. Volume spiked sharply during the sell-off but has since flattened, suggesting that selling pressure is fading.
Indicators
- RSI (42): Oversold but without clear divergence, showing neutral to slightly bearish momentum.
- MACD: Negative but improving. The histogram is rising, hinting at weakening bearish momentum. A cross above zero would confirm a bullish reversal.
- Bollinger Bands: Narrowing range that often precedes a major price expansion. Similar setups in 2021 led to rallies of more than 35%.
Fundamental Snapshot
- ETF flows: Net outflows of 184.2 million dollars, indicating short-term profit-taking.
- Staking: 29.5 million ETH locked, about 24% of total supply, showing strong holder confidence and network security.
- Fusaka Upgrade (December 2025): Expected hard fork to improve scalability and lower fees, a potential catalyst for renewed investor and developer interest.
- DeFi TVL: 42 billion dollars, stable despite the recent market decline, reflecting ongoing adoption and resilience.
Macroeconomic Context
The Fed’s hawkish stance continues to pressure risk assets, with market expectations falling by 8.2% over the week. A dovish shift, however, could quickly revive ETH’s momentum. Trade tensions are easing, and indirect stimulus measures from China could lift risk sentiment. The U.S. dollar remains firm, which limits short-term upside, but Ethereum’s strong utility case gives it more resilience compared to speculative assets.
Scenario Outlook
Bullish Case
- Break above 3,800 with solid volume.
- Next targets at 4,000 and 4,200 dollars.
- ETH/BTC ratio could rise from 0.035 to 0.08, which would imply Bitcoin near 9,000 dollars if ETH reaches 4,200.
Bearish Case
- Break below 3,700 could lead to a retest of 3,500 dollars.
- High volatility of up to 60% possible if key support fails.
Sideways Case
- Range between 3,700 and 3,800 dollars while markets await Fed direction and the Fusaka upgrade.
- Ideal period for accumulation before the next major move.
Volatility Events
Expect sharp moves around major Fed decisions, macroeconomic surprises, or unexpected protocol developments. Proper stop-loss management is essential.
Bias and Valuation
The bias remains bullish. Despite short-term weakness, Ethereum’s fundamentals are strong, with high staking levels and stable on-chain activity. The falling wedge pattern suggests consolidation rather than reversal. Valuation metrics such as MVRV and NVT remain balanced, showing no sign of overheating.
Strategy
Ethereum is coiling for its next move. The falling wedge and strong on-chain data point to a setup for continuation rather than collapse. The 50-day moving average at 3,800 is the level that will decide the next breakout.
Action Plan
- Conservative traders: Wait for a confirmed daily close above 3,800 with volume.
- Aggressive traders: Consider gradual accumulation between 3,650 and 3,700 with stops below 3,550.
- Risk focus: Monitor Fed policy and the ETH/BTC ratio, as large flows between majors can trigger chain reactions.
If Ethereum holds above 3,600 and breaks through 3,800 with momentum, a move toward 4,000 or higher becomes increasingly likely, especially if macro conditions turn supportive.
Solana (SOL)
Current Price: 168 dollars
Chart Context (Daily)
Solana continues to trade inside a strong rising channel that has been in place since March 2025. The recent pullback tested the 170-dollar support area, which held firmly and confirmed the strength of the structure. A bull flag has now formed, signaling consolidation before a possible continuation of the uptrend.
Technical Breakdown
Key Levels
- Support: 170 dollars, tested multiple times with stable reactions.
Resistance: 180 dollars as the first breakout zone, followed by 190 to 200 dollars as the next psychological targets.
Pattern
A bull flag pattern has developed after the latest rally. A confirmed breakout above 180 dollars with rising volume would mark the next bullish phase.
Price Action
Recent lows around 172 have attracted buyers, showing that accumulation is taking place during pullbacks. Volume has remained steady but moderate, signaling that sellers are exhausted even though buyers have not yet stepped in aggressively.
Indicators
- RSI (45): Neutral, reflecting healthy consolidation without overbought or oversold signals.
- MACD: Negative but flattening, showing that downward momentum is fading. A cross above zero would confirm renewed bullish energy.
- Bollinger Bands: Gradually widening, a sign that volatility is about to increase. Similar setups in 2021 preceded gains of more than 150%.
- Volume: Flat during recovery, which suggests calm conditions before the next expansion phase.
Fundamental Snapshot
- Alpenglow Upgrade (Q4 2025): Expected to reduce network fees by 40%, which should accelerate developer adoption and user growth.
- DeFi TVL: 13 billion dollars, down about 5% recently but stabilizing after correction, indicating ecosystem resilience.
- Active Users: Around one million, driven largely by activity in memecoins and NFTs.
- Evo Stablecoin: Upcoming launch expected to expand Solana’s DeFi infrastructure and attract institutional capital.
Macroeconomic Context
Trade tensions remain a challenge, with tariff-related sentiment weighing on risk assets. However, Solana’s focus on performance and scalability continues to attract attention as investors look for high-growth networks. Potential Fed rate cuts could act as a tailwind for DeFi projects, where Solana remains a leading player. The network has minimal exposure to China, making its user and developer base largely global.
Scenario Outlook
Bullish Case
- A break above 180 dollars with solid volume could open the path toward 190 and 200 dollars.
- The Alpenglow upgrade is a major catalyst that could spark renewed developer and investor activity.
- Historical patterns from 2021 show that similar setups have led to rallies of more than 150%.
Bearish Case
- A drop below 170 dollars could lead to a retest of 160 dollars.
- Volatility could reach 10% as traders unwind leveraged positions.
Sideways Case
- Price may stay between 170 and 180 dollars while the market digests macro headlines and awaits confirmation of the Alpenglow upgrade.
- This range is suitable for gradual accumulation.
Volatility Events
Expect sharp movements around memecoin activity, Fed policy updates, or surprise announcements related to Solana’s upgrades.
Bias and Valuation
The overall bias remains bullish. Solana’s network growth, stable TVL, and strong upgrade pipeline suggest that this pullback is part of a healthy trend rather than a breakdown. Valuation metrics show fair pricing relative to ecosystem expansion.
Strategy
Solana’s structure remains solid. The combination of a rising channel, confirmed support at 170 dollars, and a clear bull flag suggests that momentum could soon return.
Action Plan
- Conservative traders: Wait for a confirmed close above 180 dollars with volume.
- Aggressive traders: Accumulate between 172 and 175 dollars with stops below 168.
- Risk focus: Watch ETH/BTC movements and sentiment around memecoins, as they often drive short-term volatility.
If Solana successfully breaks through 180 dollars and holds, the move toward 190 and 200 dollars becomes likely, especially with upcoming catalysts like the Alpenglow upgrade and Evo stablecoin launch.
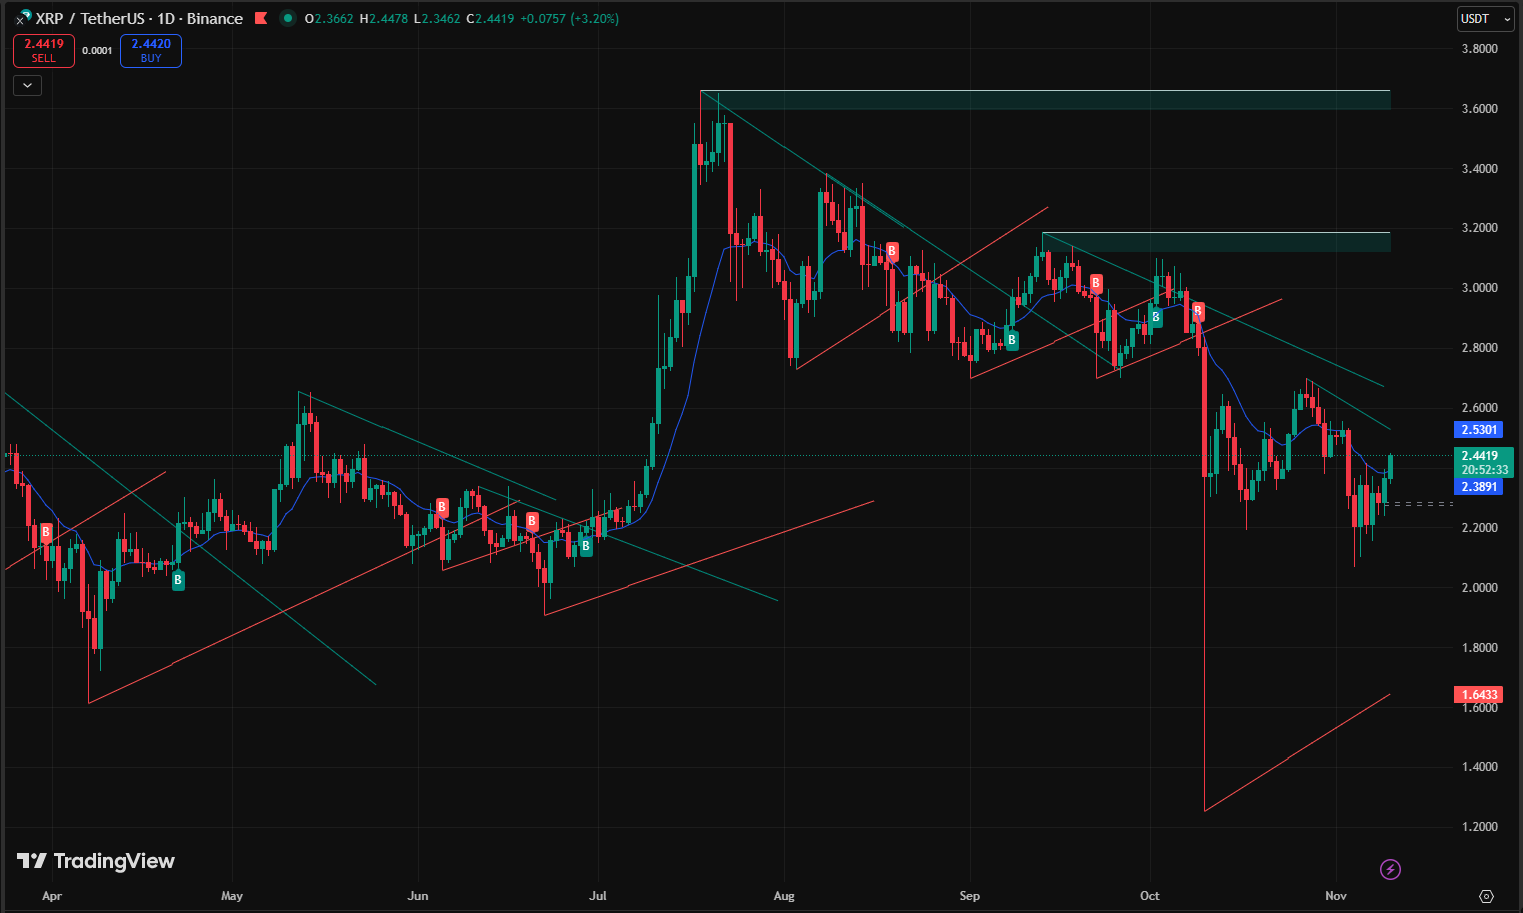
XRP
Current Price: 2.4419 dollars
Chart Context (Daily)
XRP is trading inside a descending triangle pattern that shows a series of lower highs and a flat support zone between 2.30 and 2.50 dollars. This pattern usually signals a continuation of weakness, but if the price breaks above 2.50 with strong volume, it could mark the start of a sharp rebound.
Technical Breakdown
Key Levels
- Support: 2.30 dollars, a strong psychological and structural level where buying interest has been consistent.
- Resistance: 2.50 dollars as the first breakout zone, followed by 2.70 and 2.90 dollars as the next potential targets.
Pattern
The descending triangle remains intact, showing that sellers still control short-term momentum. However, a clean breakout above 2.50 dollars would invalidate this structure and could trigger a new upward phase.
Price Action
Rebounds near 2.30 dollars continue to attract buyers, showing that traders are accumulating at the lower boundary of the range. Low volume during consolidation suggests that a decisive move is still building.
Indicators
- RSI (43): Neutral to slightly oversold, showing balanced momentum.
- Volume: Remains light, meaning that any breakout will need a significant rise in activity to confirm direction.
- Bollinger Bands: Narrowing tightly, signaling compressed volatility. Similar setups in 2021 led to rallies of about 50%.
Fundamental Snapshot
- Institutional Adoption: XRP continues to gain traction in traditional finance. SWIFT’s cross-border pilot programs totaling 5 trillion dollars highlight its potential utility.
- ODL (On-Demand Liquidity): Maintains steady usage with 1.3 billion dollars in volume, reflecting ongoing demand from financial institutions.
Macroeconomic Context
Trade tensions still weigh on sentiment, with a 5.6% weekly impact across risk assets. Even so, XRP could benefit from improving trade conditions since its primary use case focuses on cross-border payments. Easing monetary policy would also favor faster payment rails, positioning XRP as a strong candidate for renewed adoption. The weaker U.S. dollar further supports demand for settlement assets like XRP.
Scenario Outlook
Bullish Case
- Break above 2.50 dollars with convincing volume.
- Next upside targets at 2.70 and 2.90 dollars.
- Positive catalysts could include new partnerships, ETF-related speculation, or results from SWIFT pilot programs.
Bearish Case
- A drop below 2.30 dollars could lead to a test of 2.10 dollars.
- Weak volume on any breakout attempt would increase the risk of a gradual slide.
Sideways Case
- Price may stay between 2.30 and 2.50 dollars until a clear trigger appears.
- The zone is favorable for accumulation by patient traders.
Volatility Events
Expect sharper swings around major regulatory updates, results from the SWIFT pilots, or shifts in Fed policy.
Bias and Valuation
The overall bias is neutral with a focus on volume confirmation. While the current structure remains bearish, fundamentals show real-world strength that could support a reversal once momentum returns. Valuation remains balanced with no signs of speculative excess.
Strategy
XRP is in a waiting phase. Its fundamentals remain strong, but technical confirmation is needed for the next move. A breakout above 2.50 dollars with increased volume would shift sentiment to bullish.
Action Plan
- Conservative traders: Wait for a confirmed daily close above 2.50 dollars with higher volume.
- Aggressive traders: Consider gradual accumulation between 2.32 and 2.35 dollars with stops below 2.25.
- Risk focus: Track SWIFT and ODL developments closely, as institutional catalysts can shift momentum quickly.
If XRP clears 2.50 dollars with conviction, a larger rally toward 2.70 and 2.90 dollars becomes highly likely. Strong fundamentals in payments and partnerships continue to set the foundation for long-term growth once market sentiment improves.
Strategic Takeaways
Bitcoin (BTC)
Still the anchor of the market. The structure remains solid even as price stalls below 110,000 dollars. BTC continues to offer stability and moderate upside, best suited for conservative traders seeking controlled exposure.
Ethereum (ETH)
Carries the strongest fundamental story among major assets. The upcoming Fusaka upgrade and healthy staking levels make ETH the clearest setup for a potential breakout. It remains ideal for medium-term investors and DeFi-focused traders.
Solana (SOL)
Represents the highest growth potential if the Alpenglow upgrade delivers on expectations. The network’s user activity and developer momentum support a case for rapid recovery once market sentiment turns. Best for traders comfortable with volatility.
XRP
Still undervalued relative to its institutional role. While the current pattern looks neutral, strong fundamentals in payments and partnerships create a foundation for an eventual breakout. Suited for contrarian traders looking to front-run adoption.
Final Outlook
The crypto market is standing at a crossroads. Macroeconomic uncertainty from the Federal Reserve and ongoing tariff developments continue to pressure prices, but the underlying fundamentals across leading assets remain intact.
Bitcoin provides stability through its structure and long-term holder base. Ethereum offers utility and a clear upgrade catalyst. Solana delivers innovation and scalability for the next cycle of DeFi growth. XRP anchors itself in real-world finance with rising institutional engagement.
Short-term volatility is likely to persist, but each of these assets is positioned for recovery once liquidity conditions improve.
Top Trade Ideas
- Long ETH above 3,800 dollars once volume confirms a breakout.
- Long SOL near 172 to 175 dollars for exposure to ecosystem growth if Alpenglow succeeds.
- Long XRP above 2.50 dollars for a potential momentum breakout driven by institutional catalysts.
Risk Management Reminder
Use tight stops and limit exposure to 2–5% per position. Scale in and out of trades rather than going all in. Macroeconomic events such as Fed policy shifts or trade developments can override technical signals, so flexibility is key.
As markets digest the effects of tariffs, liquidity injections, and central bank positioning, resilience continues to define crypto. Strong fundamentals and steady institutional engagement point to a market preparing for its next phase of expansion.
Institutional Inflows: Stabilizing Force in Turbulence
Institutional investors continued to act as a stabilizing force through the recent volatility. Despite a 20-billion-dollar liquidation wave triggered by tariffs, total net inflows reached 720 million dollars, marking the fourth consecutive positive week.
BlackRock’s IBIT ETF led with 420 million dollars in Bitcoin inflows, followed by ETHA with 300 million dollars, pushing total ETF revenue to an annualized 260 million dollars. Fidelity and Grayscale also added capital, while Bitwise reported mining purchases at 3.5 times the usual rate even amid outflows.
Corporate buyers joined in. Metaplanet expanded its Bitcoin holdings by 632 million dollars, demonstrating how major players continue to buy on dips. On-chain ETF reserves climbed to 520,000 BTC, up five percent despite the broader market correction.
Meanwhile, Vanguard’s decision to reopen crypto trading access signaled growing institutional acceptance and the potential for trillions in new capital, echoing comments from Coinbase CEO Brian Armstrong. Reports from Crypto.news highlighted how these steady inflows helped limit market losses and predicted a surge in demand once tariff tensions ease. Venture capital activity also showed renewed confidence, with Zerohash securing 104 million dollars in funding and OranjeBTC expanding operations into Brazil.
Macroeconomic Backdrop: Tariffs Dominate, Fed Easing Counters
Trump’s 100% China tariff dominated, erasing $1T cap, $20B liquidations—record—BTC -14%, ETH/alts -15-30%. Fed 50bps cut, CPI 2.4% below forecast eased fears, unemployment 4.1%, wages moderate. China’s stimulus lift indirect, DXY 98.2 pressure. Gold $3,950, Saylor BTC superiority. BTC channel hold CPI, tariff amplified equities 0.75 correlation. Shutdown 77% drop aided rebound. Macro volatile, crypto hedge, stablecoins >$300B mints. FxPro $130K BTC if ease.
Policy Wins: Advances Amid Scrutiny
Grayscale multi-crypto ETFs approved, Bored Ape non-securities. Tether USAT, Shiba stablecoin. Kazakhstan Evo Solana/Mastercard, Naver Upbit Korea hub. SWIFT XRP $5T, Google L1 600K. UK-U.S. taskforce, EU digital-euro. WLFI USD1 Aptos, Token2049 25K, MoonPay AI. Legitimize amid probes.
Ethereum’s Resurgence and Flippening Debate
ETH $3,731 hold $3,700, Fusaka December. ETF $300M, staking 29.5M. Lee $7,500 Q4. ETH/BTC 0.035-0.09 ($9K). Lubin flippening; Chainlink $1.3M; TRON $620B. PSE 2026.
Bitcoin’s 4-Year Cycle: Tested by Crash but Intact
Bitwise’s Matt Hougan argues ETFs dampen cycle extremes, reducing winters from 80% to 40% drawdowns via steady inflows. Yet, community polls with over 9,400 participants show 62% believing the halving-driven 4-year cycle persists, citing post-2024 halving patterns: initial surge to $120K, mid-year correction to $96K, tariff dip, now positioning for Q4 peak at $130K-140K per Fibonacci extensions. Chart mirrors 2017/2021: April halving, Q3 consolidation, Q4 rally. Hyperliquid’s 45% HYPE token burn enhances scarcity, aligning with cycle’s supply reduction narrative.
Other News: Funding, Hacks, Launches
Gemini $5B IPO; Polymarket $10B; Shibarium patch $2.4M; Solana Alpenglow 40%; Jupiter $130M; Ordinals forks; Base 1.3M. Aster $680M Oct 14; Solstice SLX; USDD 8%; MetaMask $30M LINEA; Sonic breakout; ZEC/DASH/XMR rally; Hypurr $68.9K; Plasma $15B $2B; China CNH; Tether USAT; presales BlockchainFX/Pepeto/BullZilla. Zerohash $104M, OranjeBTC Brazil. UXLINK $11.3M, pre-announcement probes. Kresus wallets, Mini Apps; BNB 56.4M MAU flip; Monad checker; stablecoins $6T >Visa; outflows records. Events illustrate evolution.
Conclusion: From Chaos to Opportunity in Crypto’s Resilient Landscape
The week underscored how sensitive crypto remains to global policy shocks. Trump’s tariff move erased 1 trillion dollars in market value and triggered 20 billion dollars in liquidations within 24 hours, sending Bitcoin down 14% and major altcoins lower by 15–30%.
Yet the rebound was equally telling. Institutional inflows of 720 million dollars, rising ETF revenue of 260 million, and corporate buyers like Metaplanet provided a strong floor of demand. Fed rate cuts and cooler CPI data helped ease stagflation fears, even as the dollar and tariffs kept pressure on risk assets.
Policy progress also showed signs of maturity. The approval of Grayscale’s multi-crypto ETFs, the Bored Ape ruling, and Vanguard’s return to crypto trading marked a shift toward normalization. New launches such as Tether’s USAT, the Shiba stablecoin, and Plasma’s 15 billion–2 billion liquidity rollout reflected continued innovation.
Across regions, adoption kept expanding. Kazakhstan’s Evo network, Naver’s Upbit hub, SWIFT’s 5 trillion XRP pilot, and EU digital-euro initiatives advanced real-world integration. Developer momentum stayed strong with Ethereum’s Fusaka and Solana’s Alpenglow upgrades, BNB’s user milestone, and emerging projects like Aster, Monad, and Solstice pushing growth.
Venture funding remained healthy with Gemini’s IPO, Polymarket’s 10-billion valuation, and new rounds for Zerohash and OranjeBTC. Even as hacks and probes reminded investors of ongoing risks, fast recoveries such as Shibarium’s patch and Ordinals updates reinforced resilience.
Core fundamentals are strengthening. Stablecoin settlements now exceed Visa’s six-trillion threshold, while active user counts and developer activity keep rising. Analysts from FxPro and Crypto.news continue to see a path toward 130,000-dollar Bitcoin if macro conditions stabilize. Ethereum targets 4,000, Solana 190, and XRP 2.70, signaling the market’s readiness for recovery.
Crypto has absorbed another macro shock and held its ground. With fresh capital, regulatory clarity, and steady adoption, the sector is once again turning volatility into momentum, and chaos into opportunity.