Top 5 Crypto Backtesting Errors You Must Avoid
Crypto backtesting errors sneak up on every new quant, usually right after that first euphoric moment when a few lines of code produce an equity curve that looks unstoppable. You write a few lines of Python, press Run, and the equity curve shoots upward like BTC in 2020. Drawdowns barely exist, the balance glides higher, and for a minute you genuinely think you’ve cracked a secret money machine.
But the longer you stay in the game, the clearer it becomes: perfect curves only live inside notebooks. Outside, memecoins explode then vanish, exchanges freeze when volatility spikes, funding swings like a pendulum, and entire markets flip sentiment in minutes. Out there, the “holy grail” dies fast.
Quants have a running joke: most strategies don’t fail because the idea is bad; they fail because the data is. Hidden bias, sloppy preprocessing, and unrealistic assumptions twist the test from the very beginning. In crypto, with 24/7 trading, thin books, perps, on-chain quirks, and the occasional platform meltdown, getting clean data is harder than building the model.
This piece won’t hand you a 90% win-rate system. It gives you something far more valuable: 5 data traps I’ve stepped on myself, sometimes painfully, so you don’t have to repeat the same expensive lessons.
Why Unrealistic Equity Curves Signal Crypto Backtesting Errors
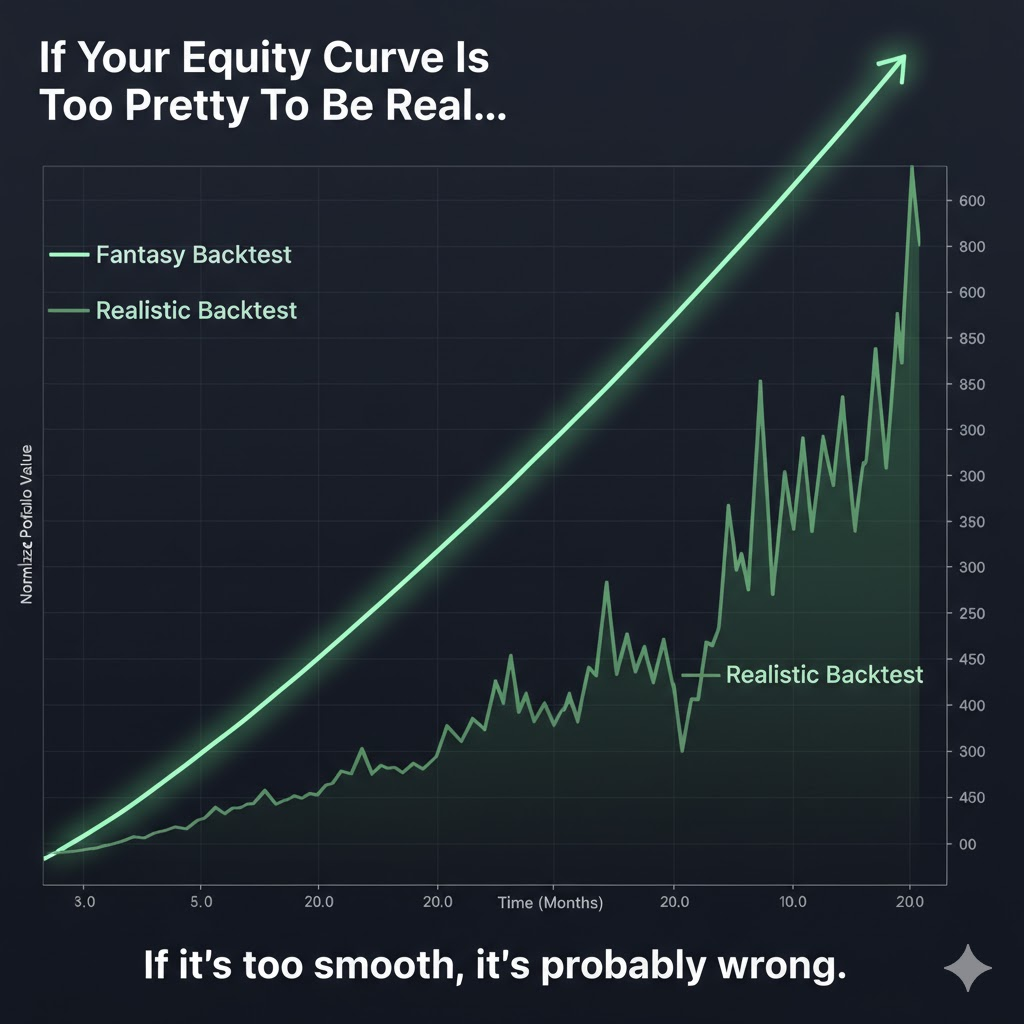
Picture this: you open the backtest and the equity curve glides upward like someone traced it with a ruler. A bit of wiggle for decoration, tiny drawdowns, green almost every month. Drop it into a pitch deck and most people would nod without blinking.
But the real market doesn’t move like that. BTC can fall 20–30% in a single session. SOL can sprint through ranges and collapse before you finish lunch. Entire altcoins vanish quietly as liquidity dries up and delistings erase their history. Exchanges lag, APIs choke, and some days the orderbook feels like a hologram.
So when your curve looks smoother than a polished highway, the question isn’t “how much leverage can I stack?” The real question is “what’s broken in my data or assumptions?” That clean line versus the jagged one in the illustration captures the truth perfectly: when everything looks too perfect, something underneath is already wrong.
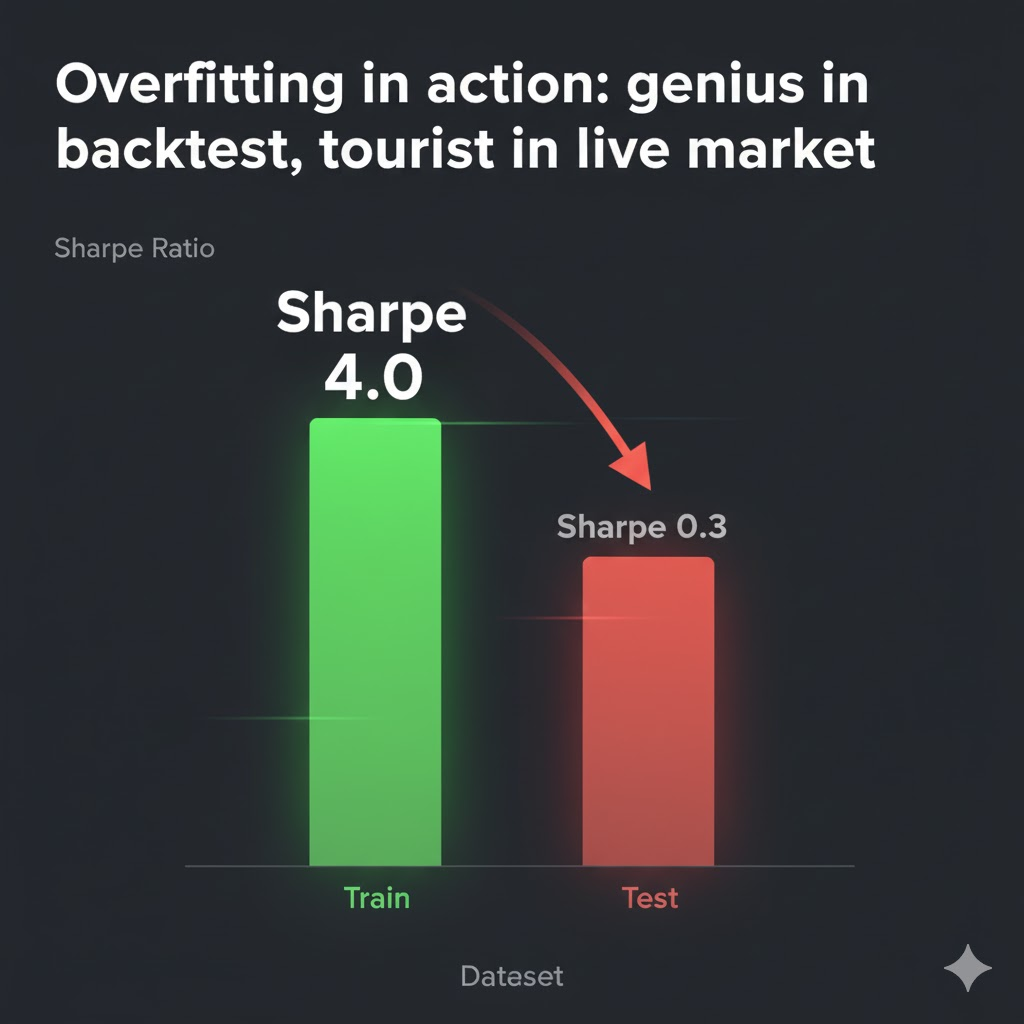
1. Overfitting: The Most Common Crypto Backtesting Error
Overfitting is the first pitfall most quants hit, and I was no different.
An overfit system doesn’t interpret structure, regime, or liquidity. It recalls every tiny move in BTC, every explosive run on SOL, every memecoin collapse. Ask it whether the market is trending, chopping, or thinning out, and it has nothing. Its entire logic boils down to “price once reacted here, so let’s try the same spot again.”
Run this type of model on the history it has already absorbed and the backtest looks flawless. Win-rates soar, Sharpe prints impressive numbers, drawdowns stay microscopic. None of this reflects live conditions. It’s equivalent to a student redoing last year’s exam with the answers still in memory.
The issue often appears when we obsess over tuning instead of validating. We adjust RSI levels, stretch EMA windows, reshape stop ranges, polish every metric until the curve looks perfect, yet never force the system to deal with fresh, untouched data. Once it faces an unseen segment of the market, performance usually sinks. Drawdowns widen. A strategy that once looked dependable reveals itself as a script anchored to historical noise.
In the Sharpe chart with a towering train bar beside a shrunken test bar, the message is clear: the model didn’t learn how markets behave; it only mastered a dataset.
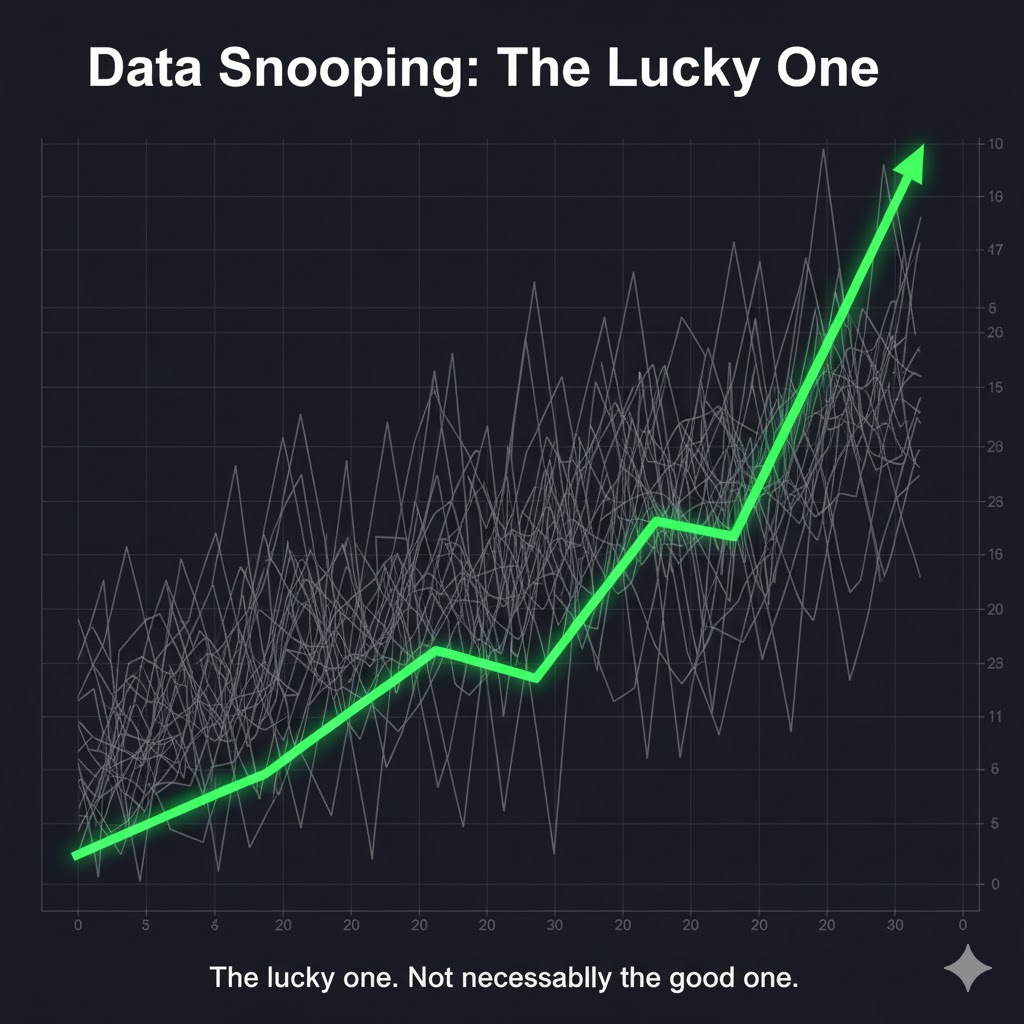
2. Data Snooping: How Endless Experimentation Creates Fake Crypto Edges
If overfitting is memorizing a dataset, data snooping is launching a flood of ideas at the same history and keeping the one result that looks amazing.
It usually starts without a real plan. You open your notebook and experiment. One day you test EMA crosses. The next day you add RSI. Then come Ichimoku, Bollinger, MACD, plus whatever indicator appears on your feed. When the five-minute timeframe fails, you switch to 15 minutes, then 1 hour, then 4 hours. When BTC refuses to deliver a clean curve, you hop to ETH, SOL, ARB, even short-lived memes.
After enough attempts, you’re almost guaranteed to hit a beautiful equity curve by pure luck. It’s the same logic as flipping hundreds of coins and being impressed when one of them lands heads ten times in a row. If you don’t track how many tests you’ve run, the lucky outcome feels like skill.
There’s also the slower version: polishing a weak strategy until the chart finally looks smooth. You add filters, adjust thresholds, tighten conditions, and shape the system around every quirk in the past. By the time it looks “good,” the model has quietly adapted to noise instead of learning behavior that repeats.
The image with one green line standing out from a crowd of grey curves shows the idea perfectly. The standout might be nothing more than chance. If you don’t know how many versions came before it, separating real insight from randomness becomes almost impossible.
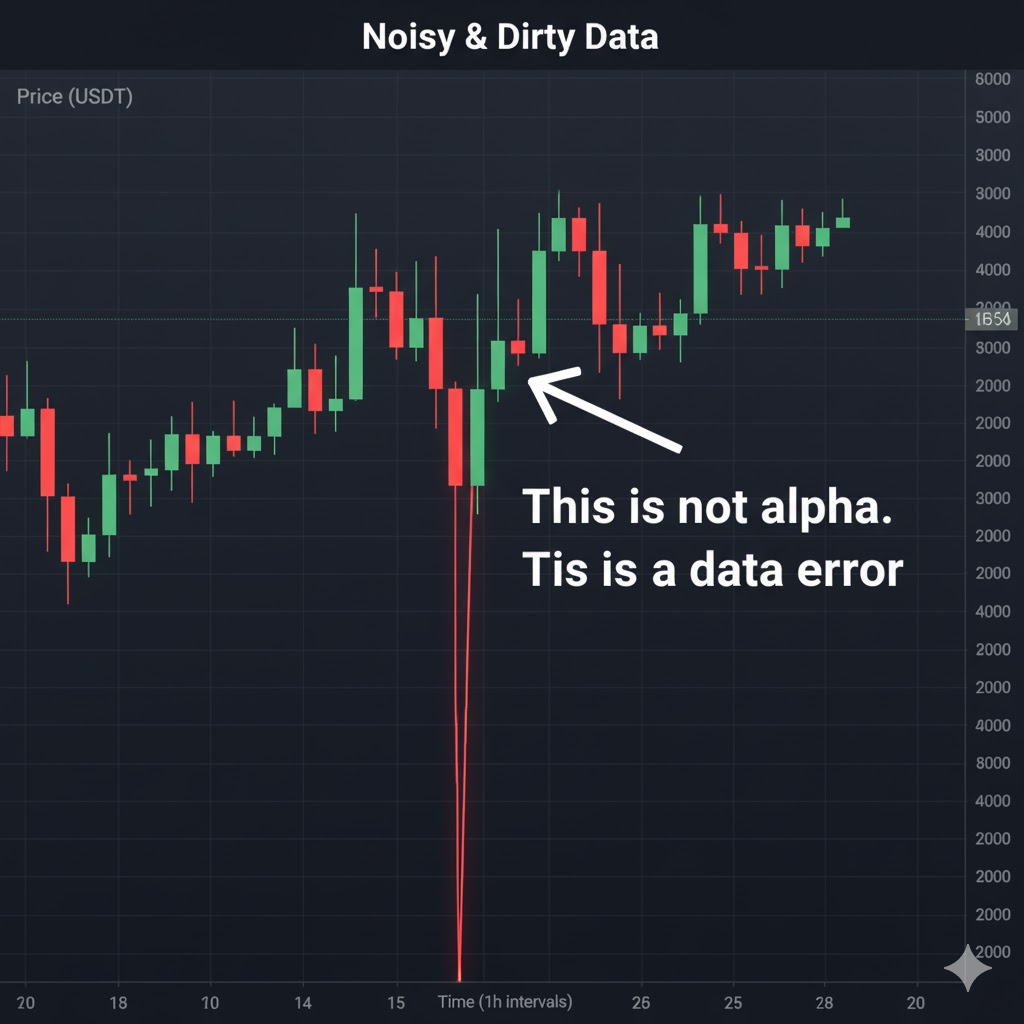
3. Dirty Data: How Bad Feeds and Survivorship Bias Ruin Crypto Backtests
Even when the idea is solid, the model isn’t overfit, and you haven’t been brute-forcing hundreds of variations, a backtest can still look unreal simply because the data is wrong.
The most common issue is price errors. A glitch, a bad feed, or a brief exchange hiccup can create a candle with a wick far outside any realistic range. If your system buys at that phantom low and exits at a normal price, the backtest logs a huge win that no trader would capture in real conditions. A few anomalies like this can twist every metric.
From there, the entire performance profile gets distorted. Sharpe inflates, drawdowns shrink, profit factor jumps. You walk away believing you’ve built a high-return, low-risk strategy, when the “edge” comes from values that never existed in the orderbook.
Another hidden hazard is survivorship bias. If your dataset only includes coins that remain active today and quietly drops everything delisted or abandoned, the backtest becomes artificially clean. The model may have held piles of dead projects in the past, but removing them makes the curve look far healthier than reality.
Crypto also has its own version of adjusted data. Tokens undergo migrations, hard forks, contract changes, supply shifts, even airdrops that reshape their history. If you merge old and new price series incorrectly or fail to adjust for these events, the entire dataset becomes unreliable. It feels like a problem for stock markets, but crypto has plenty of mechanics that demand the same discipline.
The chart with one absurd candle marked in red says it all. Not every bizarre move signals opportunity. Sometimes it’s just your dataset begging for attention.
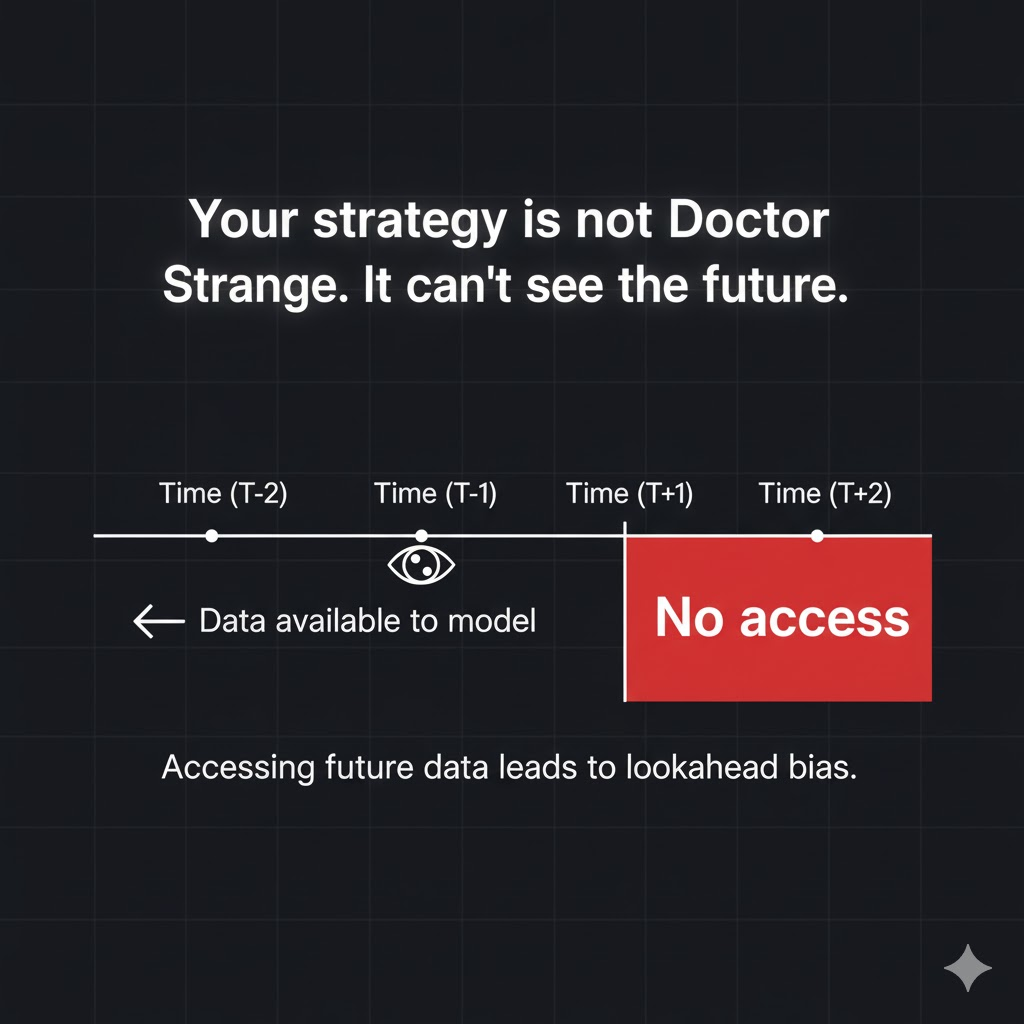
4. Lookahead Bias: The Silent Future-Leak That Inflates Crypto Backtests
Lookahead bias sounds academic, yet it appears in very ordinary situations. A common example is using the one-hour closing price to trigger a trade and assuming in the backtest the fill happens at the same level. In real trading, the close only becomes visible once the candle finishes. Unless you run an HFT system sitting next to the exchange’s matching engine, you always react one beat later and the order executes on the next candle at a different price.
Misaligned data joins create another version of the same problem. Say you rank assets by their previous seven-day performance and trade the top five. The logic is fine. However, if the ranking table and price series are merged with an incorrect offset, the model may quietly gain access to tomorrow’s prices inside today’s ranking. A one-day shift is easy to miss visually, yet for a model it becomes a clear signal of which asset will jump next.
The timeline illustration with point T and a red “No access” zone captures the rule clearly. At time T, a system may only use information available before T. Any value produced afterward, one tick, one column, one news item, must remain out of reach.
Once a strategy begins pulling future data into its inputs, the backtest stops reflecting real trading. It turns into a rewritten version of history where you always know tomorrow’s move in advance.
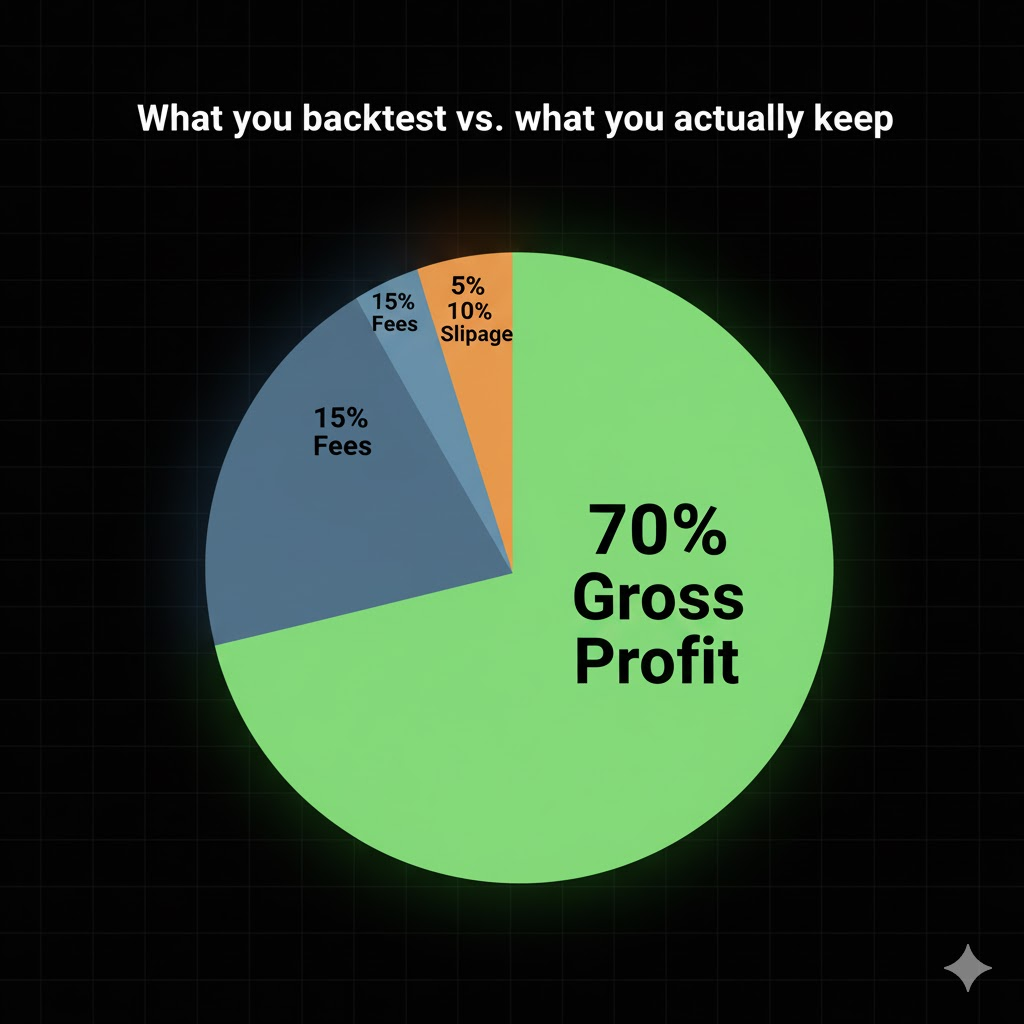
5. Transaction Costs: Why Spread, Fees, and Slippage Make Crypto Backtests Lie
Plenty of strategies look incredible in a backtest, especially fast ones that hunt for small moves. Each trade aims for a tiny gain, you fire off dozens of entries per day, and the equity curve rises without effort. All of this only works in a world where trading costs don’t exist.
Real markets tell a different story. The moment you use a market order, you pay the spread. You buy above the best bid or sell below the best ask. On major pairs the spread feels small, but with high turnover it quietly eats a meaningful chunk of your profit.
Then come the fees. Maker or taker, the exchange still charges you. Depending on your tier, it can sit anywhere between 0.02 and 0.1% per side. For strategies built on thin margins, fees alone can erase most of the theoretical gain per trade.
Slippage adds another layer of pain. When volatility spikes or the orderbook thins out, your real fill drifts away from the price your backtest assumed. You aim for a clean 0.2% gain, yet after spread, commission, and slippage, the actual result may shrink to 0.05%. On rough days, the trade can even flip red.
The profit breakdown in that pie chart makes the point obvious. Gross returns look impressive, but once you subtract all the friction, the net result barely resembles the backtest. If you ignore trading costs, you aren’t evaluating a strategy in a real market. You’re simulating a world that never existed.
Backtest Checklist: Questions to Ask Before You Deploy Real Capital
One lesson I learned the hard way, after a few painful “the backtest fooled me” blow-ups, is this: before you put real capital at risk, stop and ask yourself several uncomfortable questions.
Have you fully cleaned your data, or are broken candles, dead tokens, and strange anomalies still hiding inside your feed? Is the model actually learning market behavior, or acting like an expensive pattern recorder tied to one narrow period? Do the shiny performance numbers come from real edge, or are they simply the lucky survivor of countless experiments? Have you modeled costs with realistic, even pessimistic assumptions, with wider spreads and heavier slippage than you prefer to admit? And finally, does your pipeline truly prevent future leakage, or are a few joins still drifting by a bar or a day?
If any honest answer sounds like “I’ll fix it later,” then waiting to deploy is probably the only responsible move.
Conclusion
A backtest is a rear-view mirror, never a forecast. It simply answers the question, “If I had traded this way before, what would the outcome have looked like?” It says nothing about what comes next. In crypto, where chaos is standard, the only real control you have is the integrity of your data and assumptions.
Once you stop your model from memorizing history, block every hint of future information, clean the feed, and include every unpleasant cost, the real work begins: building ideas, choosing timeframes, shaping execution. A strategy that looks ordinary but honest is far more valuable than a perfect curve generated by bad ticks and broken CSVs.
And if any part of this feels uncomfortably familiar, that is normal. Every quant walks through this phase. What matters is the response. Do you fix the pipeline and correct the data, or convince yourself the Holy Grail is already in your hands?