Crypto Market Recap (Oct 6–13): Tariff Shock and Rebound
This Weekly Crypto Recap captures one of 2025’s most volatile trading weeks. The market reached record highs before a tariff shock from Washington triggered a $1 trillion drawdown. Despite heavy liquidations, institutional inflows, and ETF momentum, restored stability, setting the tone for a new recovery phase. From Bitcoin’s rebound to Ethereum’s renewed strength, the data shows resilience behind the chaos.
A Week of Extreme Swings and Tariff Turmoil
The cryptocurrency market from October 6 to 13, 2025, delivered one of its most intense weeks of the year. Prices exploded to new all-time highs before a sudden tariff shock sent the market into chaos. Capitalization climbed beyond $4.5 trillion midweek, then dropped to $3.94 trillion as heavy liquidations crossed $7 billion within a single day. The movement showed how quickly euphoria can turn into fear when geopolitics enters the market narrative.
The announcement of a 100% additional tariff on China by U.S. President Donald Trump triggered a chain reaction across risk assets. Bitcoin (BTC) fell from $125,708 to below $104,000, later closing the week at $115,231.70 with a modest daily rebound of 3.1%. Ethereum (ETH) moved in the same pattern, testing $3,878 before recovering to $4,170.72, up 8.7% on the day.
Among major altcoins, recovery was swift: Solana (SOL) traded near $198.01, XRP at $2.6296, and BNB at $1,342.03, each showing double-digit intraday gains after deep midweek sell-offs.
Daily trading volume reached an average of $267.37 billion, a 42% jump from the previous week. Panic selling turned into aggressive buying as traders repositioned for the next move. The CMC Fear and Greed Index dropped to 40, showing the emotional reset that often precedes new momentum.

From the CoinMarketCap overview (Image 1: Crypto Market Overview dashboard displaying total cap at $3.94T, volume $267.37B, Fear & Greed at 40, Altcoin Season Index at 43, and CoinMarketCap 20 Index at $250.18 +5.37%), the correction is clear: the cap line dips sharply from early-October highs, testing $3.8T with volume spikes on sell-offs.
Analysis of Crypto Total Market Cap and Indices
The CoinMarketCap dashboard (Image 1) reflected a market that absorbed the shock but held firm above key supports. Total capitalization stood at $3.94 trillion, up 0.34% day-over-day. Despite the tariff sell-off, the structure remained intact relative to September levels.
Trading activity stayed strong. The average $267.37 billion volume showed heavy liquidation early in the week followed by steady accumulation. Bitcoin dominance rose to 57.2% as investors sought safety, while altcoin share slipped to 42.8%. This rotation pattern has historically marked early stages of recovery, similar to market behavior seen in 2021’s fourth quarter.
October continues to show its seasonal strength. Over the last decade, Bitcoin has averaged 28% monthly gains, and the current setup mirrors those cycles. The combination of reduced leverage, higher spot volumes, and institutional flows sets the stage for renewed upside once macro pressure eases.

The CMC Fear and Greed Index closed the week at 40, reflecting a sharp mood swing from the previous level of 59. The lowest reading reached 31, capturing the moment of capitulation during the tariff-driven crash. Sentiment recovered gradually through the weekend as buyers returned.
The BTC price-volume overlay on Image 2 highlights this sentiment arc. Panic created the deepest red candles midweek, then buying pressure reappeared as institutional inflows entered the market. Historically, neutral readings around 40 have often preceded major upside moves when liquidity improves.

The CMC Altcoin Season Index at 43/100 (Image 3: Altcoin Season Index chart at 43, historical: yesterday 40, last week 63, last month 72) signals rotation pause, down from 63, with alt cap contracting on crash. Breaches below 50 historically mark Bitcoin seasons, but up from last month's 72 suggests potential reignition if BTC tops out.
Technical Analysis and Outlook for Key Tokens
The technical analysis of the cryptocurrency market as of October 13, 2025, reveals a corrective pullback within an overarching uptrend, with major tokens testing supports after tariff-induced volatility but showing rebound signs. Market sentiment, per the Fear and Greed Index at 40, reflects fear amid macro shocks like Trump's China tariff, yet the Altcoin Season Index at 43 indicates a shift toward Bitcoin dominance during uncertainty. This section examines setups for BTC, ETH, SOL, and XRP, incorporating price action, RSI/moving averages, volume profiles, and patterns, with scenarios supported by historical precedents and on-chain corroboration.

USDT on Binance traded near $114,958 at the close of the week, maintaining its long-term ascending channel that began in February 2025. The $112,000 area served as a strong reaction zone during the tariff shock, confirming deep liquidity support.
Momentum indicators remain constructive. RSI rests near 48, and Bollinger Bands show a tightening pattern that often leads to expansion phases. Volume declined after the initial sell-off, indicating exhaustion among short positions.
Possible scenarios:
- A move above $118,000 could unlock targets between $122,000 and $125,000, following the same pattern observed in early 2022 rebounds.
- Holding above $112,000 keeps the mid-term outlook favorable, with buyers controlling market structure.
- Key support remains firm, and the overall bias stays moderately bullish as long as outflows continue from exchanges.

Ethereum closed at $4,174, trading just below the $4,200 mark that aligns with the 50-day moving average. The structure holds a clear ascending trendline from $3,600, confirming the continuation of higher lows since September.
Technical signals suggest a potential recovery. RSI around 46 points to renewed energy, and narrowing volatility bands indicate compression before expansion. The Fusaka mainnet, scheduled for December, adds an additional narrative catalyst.
Outlook:
- A break above $4,300 could lead to $4,500–$4,700, continuing the bullish structure.
- Range trading between $4,100 and $4,300 may persist until macro clarity improves.
- The near-term bias remains neutral to bullish, supported by strong staking demand and rising ETF inflows.

Solana closed at $196.99, remaining inside its rising channel from March. The price reacted firmly to the $190 support zone, which attracted high spot volumes. RSI around 52 shows balanced momentum, while the MACD continues to build a positive cross.
Scenarios:
- A sustained move above $200 targets the $220–$240 range, matching the historical recovery pattern seen in 2021.
- The ecosystem remains robust, supported by 1 million active users and $13.5 billion in total value locked, positioning Solana as one of the most resilient Layer 1 chains.
- Overall sentiment remains bullish, with volatility expected to tighten before the next breakout.
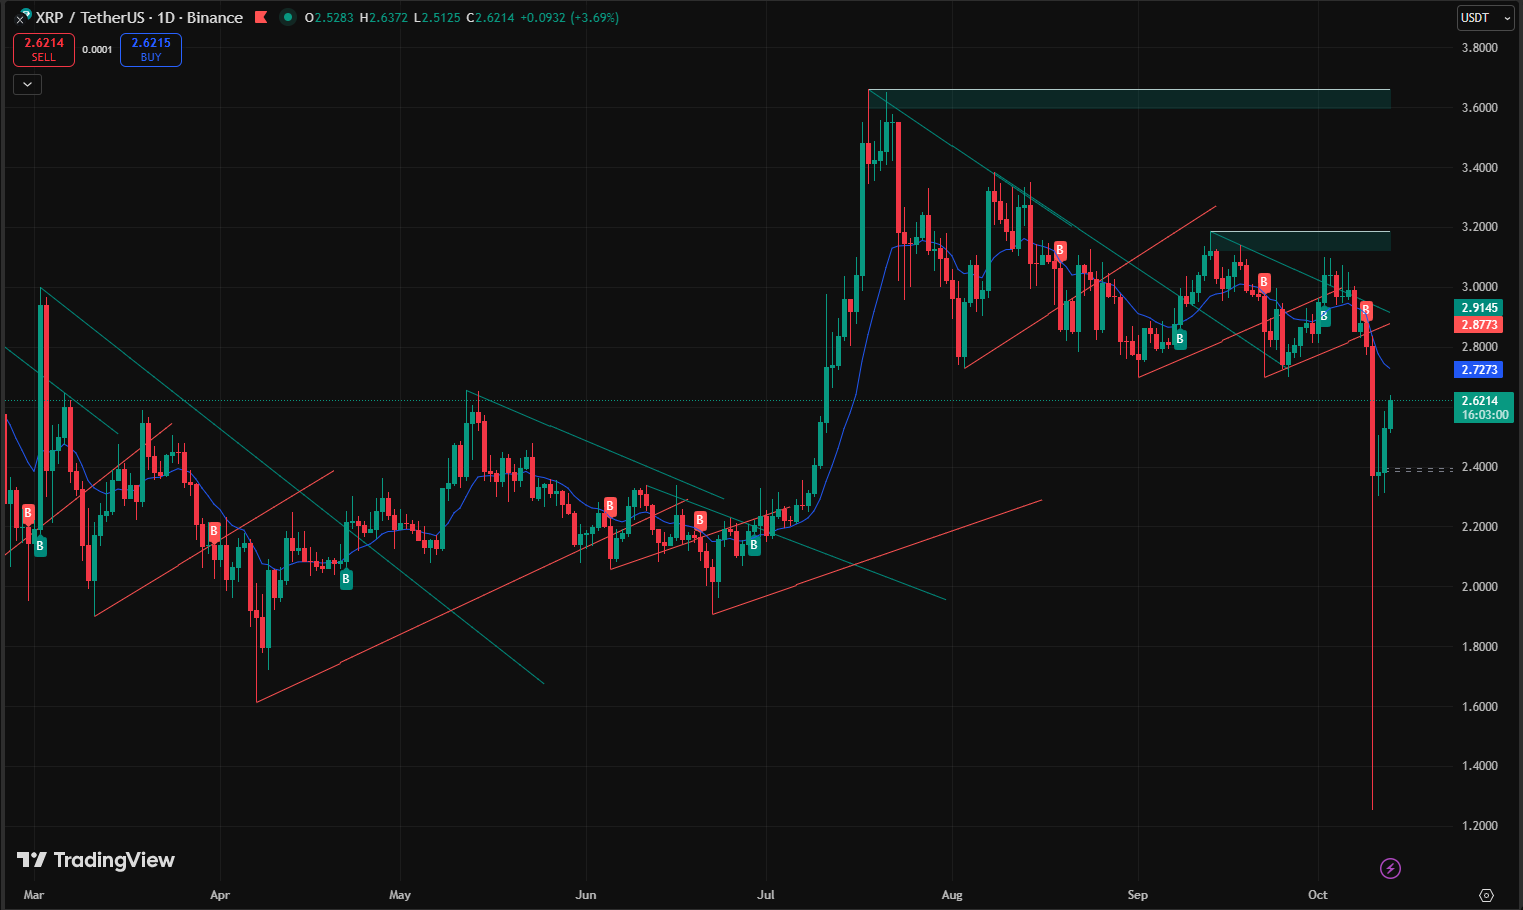
XRP ended the week at $2.582, trading within a tight zone between $2.50 and $2.70. The structure shows a descending triangle nearing completion, and RSI at 42 points toward recovery potential once volume returns.
Outlook:
- A breakout above $2.70 could send prices toward $2.90–$3.10, supported by expanding use cases in SWIFT pilot programs.
- Sustained interest from institutional payment networks continues to anchor long-term demand.
The technical setup indicates accumulation at current levels, preparing for the next trend expansion.
The outlook favors recovery, entries at supports for post-tariff gains.
Institutional Inflows: Providing Stability Amid Chaos
Institutional capital remained a stabilizing force through the volatility. Total inflows reached $720 million, extending the streak to a fourth consecutive week. BlackRock’s IBIT contributed $420 million, while Ethereum products attracted $300 million in net inflows.
Despite price turbulence, ETF revenue expanded to $260 million annualized, showing consistent investor engagement. Corporate entities continued to increase exposure, with Metaplanet holding 5,419 BTC valued at $632 million.
Data from Crypto.news and Bitwise confirmed that ETF buying volumes remained more than three times current mining output, offsetting the midweek sell-off. The entrance of new players such as Vanguard, considering direct crypto trading integration, reflects deepening institutional conviction in the asset class.
Macroeconomic Backdrop: Tariff Shock Overshadows Easing
The announcement of U.S.–China tariffs reshaped the global risk landscape. The policy added direct pressure on equities and crypto markets, wiping nearly $1 trillion from total capitalization in a single day.
Meanwhile, the Federal Reserve’s 50 basis-point rate cut and softer inflation data at 2.4% created a favorable counterforce. The DXY index at 98.2 strengthened temporarily, but capital rotation into hard assets quickly resumed.
Unemployment at 4.1% and stable wage growth reduced fears of stagflation. In commodities, gold surged to $4,080 per ounce, yet Michael Saylor’s commentary reinforced Bitcoin’s growing appeal as a superior macro hedge.
With the Polymarket odds for a U.S. government shutdown dropping to 77%, risk appetite began to return. The overall macro setting remains complex, but liquidity support and policy easing continue to strengthen the long-term case for digital assets.
Policy Wins: Approvals and Launches Bolster Confidence
Grayscale's multi-crypto ETF approvals mark milestones, Bored ApeNFTs ruled non-securities. Tether's USAT stablecoin boosts U.S. presence, Shiba Inu launches stablecoin. Kazakhstan's Evo with Solana/Mastercard, Naver's Upbit control strengthens Korea. SWIFT XRP pilots $5T potential, Google's L1 onboard 600K. UK-U.S. taskforce, EU digital-euro advance. WLFI USD1 on Aptos October 6, Token2049 25K attendees, MoonPay AI tools. Wins, per reports, legitimize amid scrutiny.
Ethereum's Resurgence and Flippening Debate
ETH $4,174 holds $4,100, Fusaka Holesky success, mainnet December. ETF $300M, staking 29.5M. Lee $8,000 Q4. ETH
BTC 0.036 to 0.09 ($11K ETH). Lubin flippening on utility; Chainlink $1.3M; TRON $620B. PSE privacy 2026.
Bitcoin's 4-Year Cycle: Crash Within Bull Phase
Hougan on ETF damping winters, polls 62% see cycle. Chart: halving surge, Q4 ATH $140K-150K despite crash. Hyperliquid 45% HYPE burn aids scarcity.
Other News: Airdrops, Hacks, and Ecosystem Growth
Gemini $5B IPO; Polymarket $10B raise; Shibarium patch after $2.4M hack; Solana Alpenglow 40% cut; Jupiter $130M TVL; Ordinals soft forks; Base 1.3M trades. Aster $680M airdrop October 14; Solstice SLX farming; USDD 8% hold-earn; MetaMask $30M LINEA; Sonic wedge breakout; Privacy ZEC/DASH/XMR rallies; Hypurr NFTs $68.9K floor; Plasma $XPL $15B val $2B liquidity; China's CNH stablecoin; Tether USA₮; presales BlockchainFX/Pepeto/BullZilla. Zerohash $104M, OranjeBTC Brazil entry. UXLINK $11.3M hack, pre-announcement probes. Kresus smart wallets, Mini Apps launch; BNB Chain 56.4M MAU flips Solana; Monad airdrop checker hype. Stablecoins surpass Visa Q1 at $6T; coins exit exchange records.
Conclusion: Navigating Post-Crash Recovery for Potential Q4 Boom
The week of October 6–13 captured the full spectrum of crypto volatility. Record highs met with tariff shocks, leading to $7 billion in liquidations and a $1 trillion drawdown. Yet, institutional inflows, ETF approvals, and rising stablecoin supply created the foundation for a new recovery phase.
Key catalysts now align for a potential Q4 surge. Ethereum’s Fusaka upgrade, Solana’s ecosystem growth, and high engagement from major funds all point toward renewed confidence. With stablecoin circulation above $300 billion and leverage steadily declining, the market enters the final quarter with stronger footing.
Analysts from FxPro and Crypto.news forecast Bitcoin reaching $140,000 by December, provided tariff tensions ease. The Altcoin Season Index at 43 suggests room for a 20–50% rotation rally as capital flows from BTC back into large caps.
Despite heavy volatility, the market structure holds firm. Liquidity is deep, institutional participation is growing, and builders continue to deliver across ecosystems. The path forward remains ambitious, driven by innovation, capital strength, and the resilience that defines every crypto cycle.