Crypto Market Volatility: $20B Liquidations and Recovery
A Week of Geopolitical Shockwaves and Recovery Attempts
The crypto market entered one of its most turbulent weeks of 2025. From October 13 to 20, escalating U.S.–China trade tensions triggered a wave of crypto liquidations, wiping out billions in positions before institutional buyers and technical support helped spark a sharp rebound.
Total market capitalization fell from $3.94 trillion to a low near $3.5 trillion in the middle of the week before recovering to $3.74 trillion by Sunday’s close. The shock began after President Donald Trump announced a 100% tariff on Chinese imports, sending investors rushing out of risk assets and wiping out $20 billion in crypto derivatives within hours - the largest single-day liquidation in market history.
Bitcoin (BTC) absorbed the heaviest hit, dropping from $115,231.70 to $104,782.88, a 14 percent fall, before stabilizing around $110,210.27 with a slight daily gain of 2.84 percent. Ethereum (ETH) saw deeper swings, falling 15 to 30 percent across spot and futures markets before rebounding from $3,878 to $4,040.58. Major altcoins followed a similar path: Solana (SOL) closed at $191.64, XRP at $2.6296, and BNB at $1,342.03, each showing moderate recovery after steep intraday drops.
Trading activity surged to an average of $151.82 billion per day, up 42 percent from the previous week. Panic selling during the tariff shock gave way to sharp bargain hunting as volatility spiked across exchanges. The Fear and Greed Index slid to 30, down from 40, reflecting a rapid shift from neutrality to fear as more than $162 billion in open positions were liquidated midweek.
Even amid the chaos, stabilizing forces began to surface. Institutional inflows reached $3.24 billion into U.S. spot Bitcoin ETFs and $1.3 billion into Ethereum ETFs, acting as a crucial anchor. On the development front, Tether launched its USAT stablecoin, Monad released airdrop eligibility tools, and Grayscale gained approval for its multi-crypto ETFs. Vanguard hinted at a potential return to crypto trading, adding a sense of long-term confidence.
The week wasn’t without setbacks. UXLINK’s $11.3 million hack reignited discussions about on-chain security, while stablecoin data showed resilience: total supply held at $300 billion despite $4.2 billion in outflows during the crash. Corporate buyers such as Metaplanet continued accumulating, helping to offset whale distributions and calm short-term pressure.
Narratives shifted quickly as new momentum stories emerged. Hyperliquid’s 45 percent HYPE burn, Aster’s $680 million airdrop, and renewed rallies in privacy coins after the Bored Ape non-securities ruling reflected the market’s creative resilience. In Asia, Kazakhstan’s Evo stablecoin and Naver’s acquisition of Upbit reinforced regional strength and liquidity depth.
This intense week recalled the volatility of 2021, when heavy liquidations were often followed by equally sharp recoveries. Analysts at FxPro and Crypto.news have raised their Bitcoin year-end targets to $130,000, contingent on a cooling of tariff tensions. With $3.2 billion in token unlocks ahead, the market still faces risks, yet the decline in leverage and steady outflows from exchanges suggest a healthier, more disciplined foundation.

From the CoinMarketCap overview (Image 1: Crypto Market Overview dashboard displaying total cap at $3.74T, volume $151.82B, Fear & Greed at 30, Altcoin Season Index at 26, and CoinMarketCap 20 Index at $237.78 +3.14%), the crash and recovery are vivid: the cap line plummets from mid-October highs near $4T, bottoming at $3.5T before bouncing, with volume spikes on down days.
Analysis of Crypto Total Market Cap and Indices
The CoinMarketCap overview (Image 1) shows a market gradually finding balance after a week of intense volatility. Total capitalization stands at $3.74 trillion, up 0.68% for the day, while major assets show signs of recovery, with Bitcoin gaining 2.84%, Ethereum up 3.58%, BNB rising 3.24%, Solana advancing 2.51%, and XRP climbing 3.35%. The sharp fall from $3.94 trillion erased the gains of early October but held above September’s low of $3.5 trillion, suggesting that long-term confidence remains intact.
Trading volume reached $151.82 billion, up 5%, reflecting a shift from panic-driven liquidations to renewed accumulation. Bitcoin’s market dominance increased to 57.5%, tightening the space for altcoins at 42.5% as investors temporarily favored safer assets. This behavior mirrors the defensive positioning seen in 2022’s downturns, although similar conditions in 2021 later set the stage for strong recoveries.
The 30-day chart captures the pattern clearly: a sudden drop to $3.5 trillion after the tariff shock, followed by a quick rebound above the 50-day moving average at $3.65 trillion. The movement resembles the resilience displayed in 2023, when rapid capitulations often preceded new upward momentum. Historical data for October supports this outlook, as past declines driven by fear have frequently given way to strong rallies once confidence returned.
Among leading networks, Ethereum’s 17% market share contracted slightly as DeFi outflows reduced total value locked to $42 billion. Solana stabilized near 3%, while XRP slipped to 1.2%. Although tariff risks continue to weigh on sentiment, new stablecoin issuance worth $4.2 billion has strengthened liquidity across the ecosystem, cushioning volatility and reinforcing the market’s underlying stability.
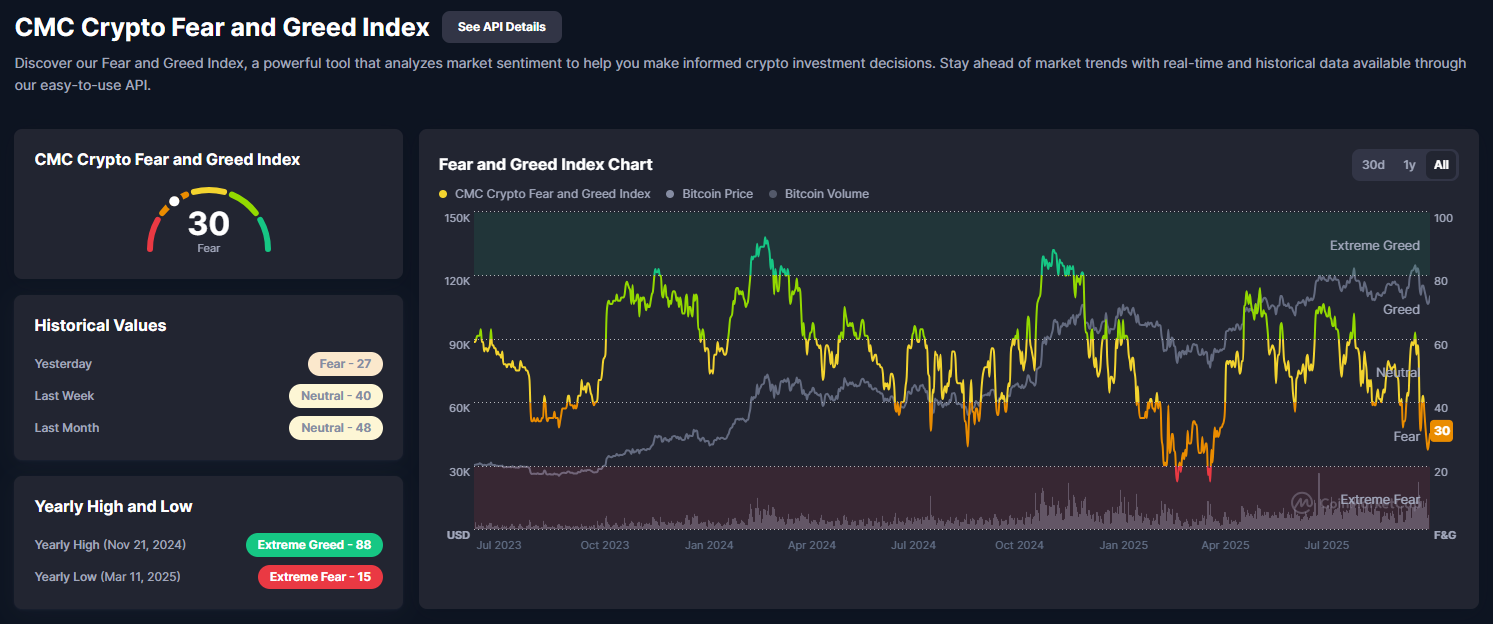
The CMC Crypto Fear and Greed Index at 30 (Fear) (Image 2: Fear and Greed Index chart with current 30, historical: yesterday 27, last week 40, last month 48) reflects the tariff panic, with BTC price/volume overlay showing sentiment lows on crash day but upticks in recovery. Yesterday's 27, last week's 40, and last month's 48 highlight volatility, driven by $20B liquidations. Yearly highs at 88 and lows at 15 frame this as a fear opportunity, with components like volatility (+15%) and social decline of 10%. Past Fear Octobers preceded +25% moves.
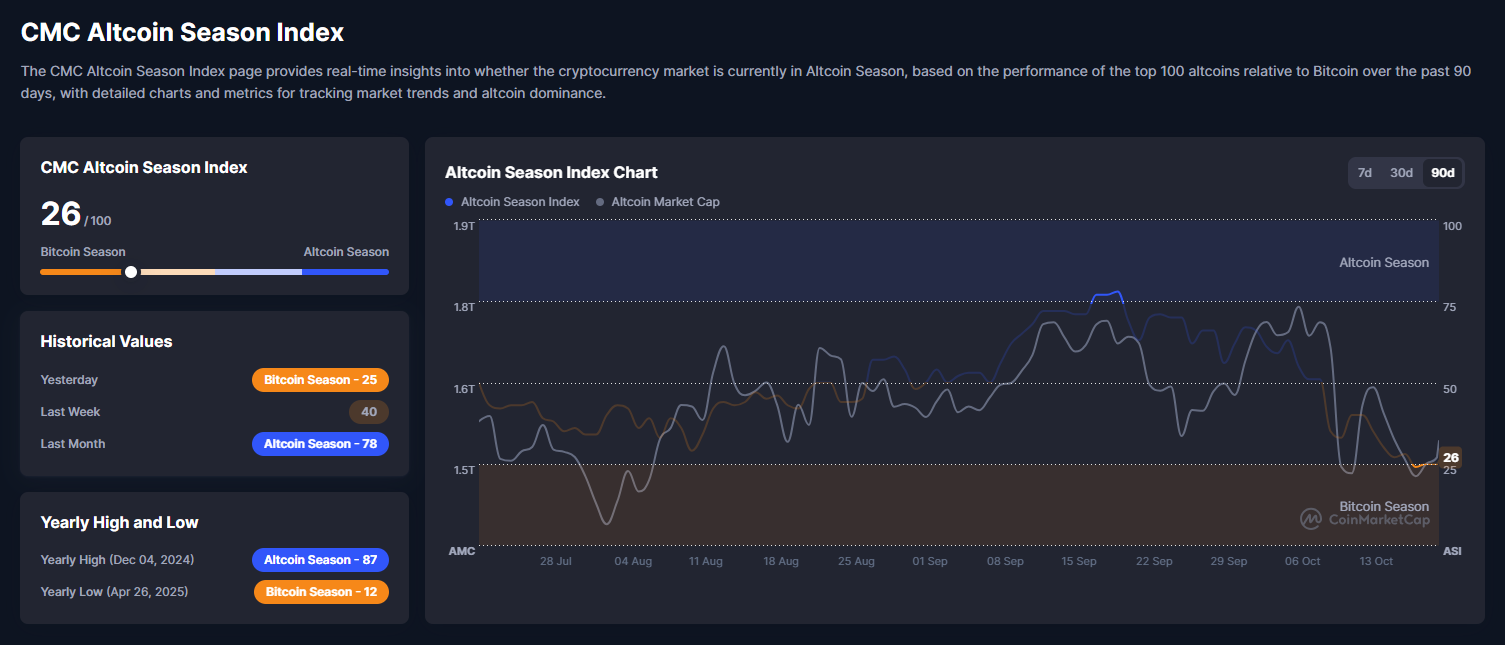
The CMC Altcoin Season Index at 26/100 (Image 3: Altcoin Season Index chart at 26, historical: yesterday 25, last week 40, last month 78) signals Bitcoin season dominance, down from 40, with alt cap contracting. Breaches below 50 mark shifts, but historical lows in October often precede alt rebounds.
Technical Analysis and Outlook for Key Tokens After Crypto Liquidations
As of October 20, 2025, the cryptocurrency market is entering a phase of consolidation after the recent crash, while the broader uptrend remains intact. Most leading assets experienced sharp declines early in the week, followed by clear signs of recovery at key support levels.
Market sentiment is still cautious. The Fear and Greed Index stands at 30, reflecting ongoing unease after the tariff shock. Meanwhile, the Altcoin Season Index at 26 shows a temporary shift of capital toward Bitcoin as investors prioritize safety. Historically, these conditions have often preceded the return of liquidity to altcoins once market stability improves.
This section takes a closer look at the technical setups of Bitcoin (BTC), Ethereum (ETH), Solana (SOL), and XRP. Each analysis includes price structure, RSI and moving average trends, volume behavior, and chart patterns. Possible market paths are presented with references to previous cycles and on-chain data, providing a grounded view of how the market could evolve in the coming weeks, assuming no major external shocks such as new tariffs occur.
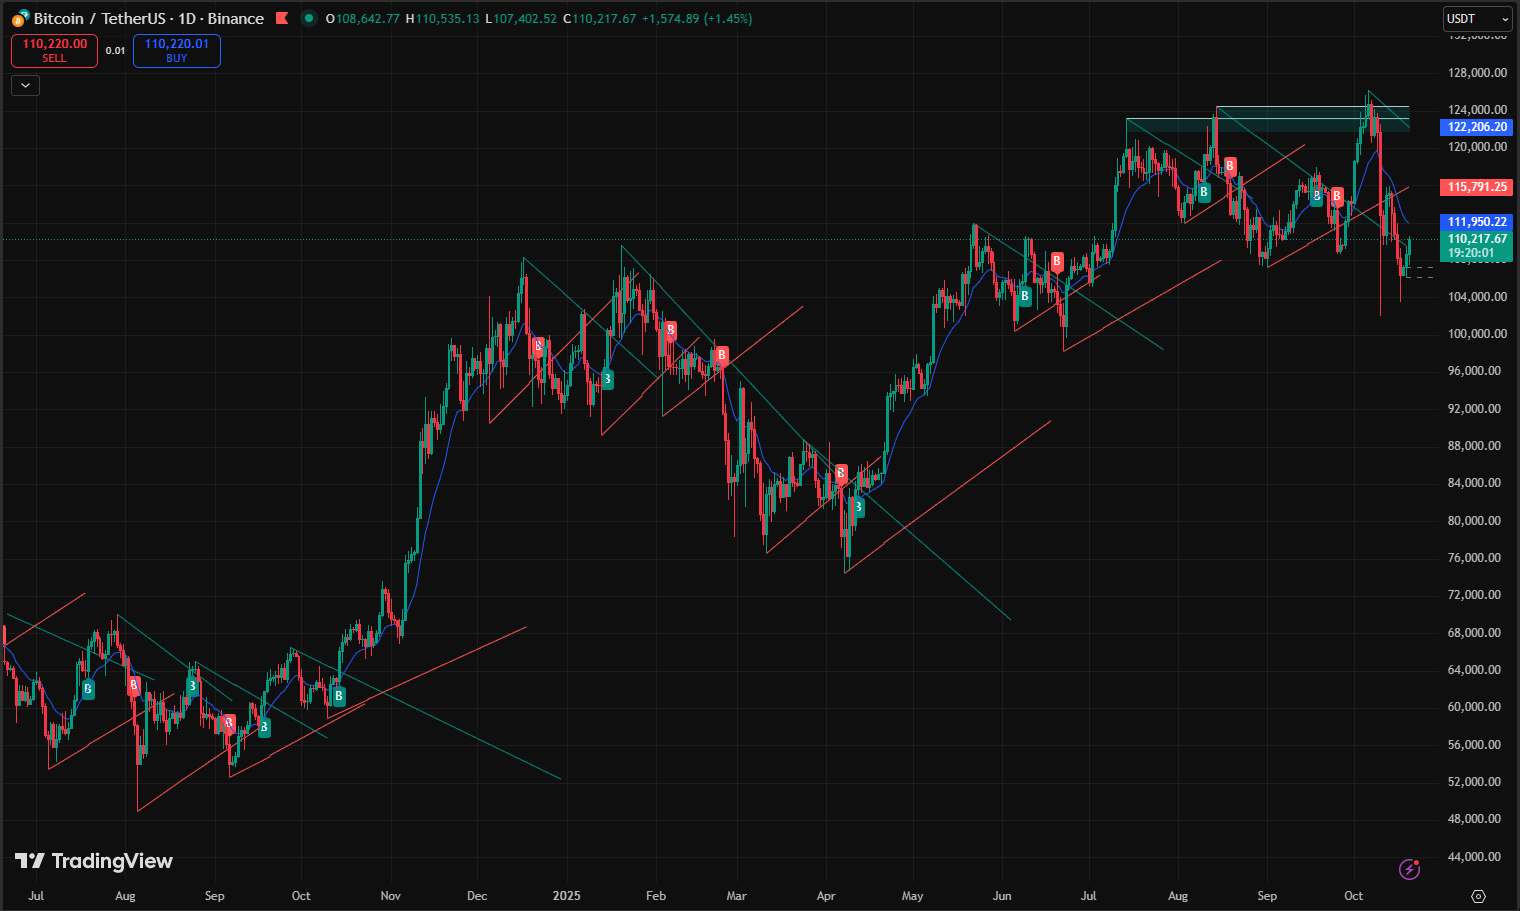
For Bitcoin (BTC/USDT on Binance, Image 4: The daily chart shows Bitcoin trading at $110,642.77, up 1.45%, and still moving inside an ascending channel that has been in place since February 2025. The larger structure remains bullish on higher timeframes, with $104,000 acting as dynamic support during the tariff-driven crash that briefly pushed BTC down to $104,782.88.
Since the July dip at $96,000, the price has continued forming higher lows. The sharp decline from the all-time high of $122,574.46 resulted in a quick V-shaped reversal, now consolidating below the 50-day moving average at $115,000, which serves as immediate resistance. A descending wedge pattern has developed from the early-October high, showing resistance lines compressing toward a rising base. Buy zones have appeared near $107,000, while selling pressure tends to build around $118,000.
Volume surged sharply during the sell-off, signaling capitulation, but has since slowed as buyers returned. The RSI at 48 remains neutral, yet shows a bullish divergence from the oversold level below 30 seen at the crash low. Bollinger Bands have expanded significantly after a long squeeze, often a precursor to strong volatility as seen in 2021 when similar setups led to 20–50% swings. The MACD histogram is flattening after a bearish crossover, while on-chain data shows long-term holders controlling 73% of circulating BTC and exchange inflows continuing to drop, both signs of accumulation.
Possible Scenarios for BTC:
- Uptrend continuation: If price holds above $115,000, BTC could move toward $120,000–$122,000, retesting the all-time high if institutional inflows strengthen. This would align with historical post-liquidation rallies in 2021 that delivered 40–60% gains from local lows, supported by NUPL readings above 0.5.
- Downtrend risk: A break below $104,000 could push BTC down to the 200-day moving average near $100,000, or even back to $96,000, as leverage remains elevated with open interest around $39 billion.
- Range-bound phase: Short-term consolidation between $104,000 and $115,000 appears most probable, with daily volatility of roughly 5–7%, a range favorable for short-term trading while tariffs remain uncertain.
- Volatility surge: Any shift in geopolitical tone, positive or negative, could trigger 10–15% daily moves.
Overall Bias: Neutral to bullish in the medium term, with risk-reward favoring accumulation on dips. The MVRV ratio at 2.6 continues to indicate fair value after the correction.
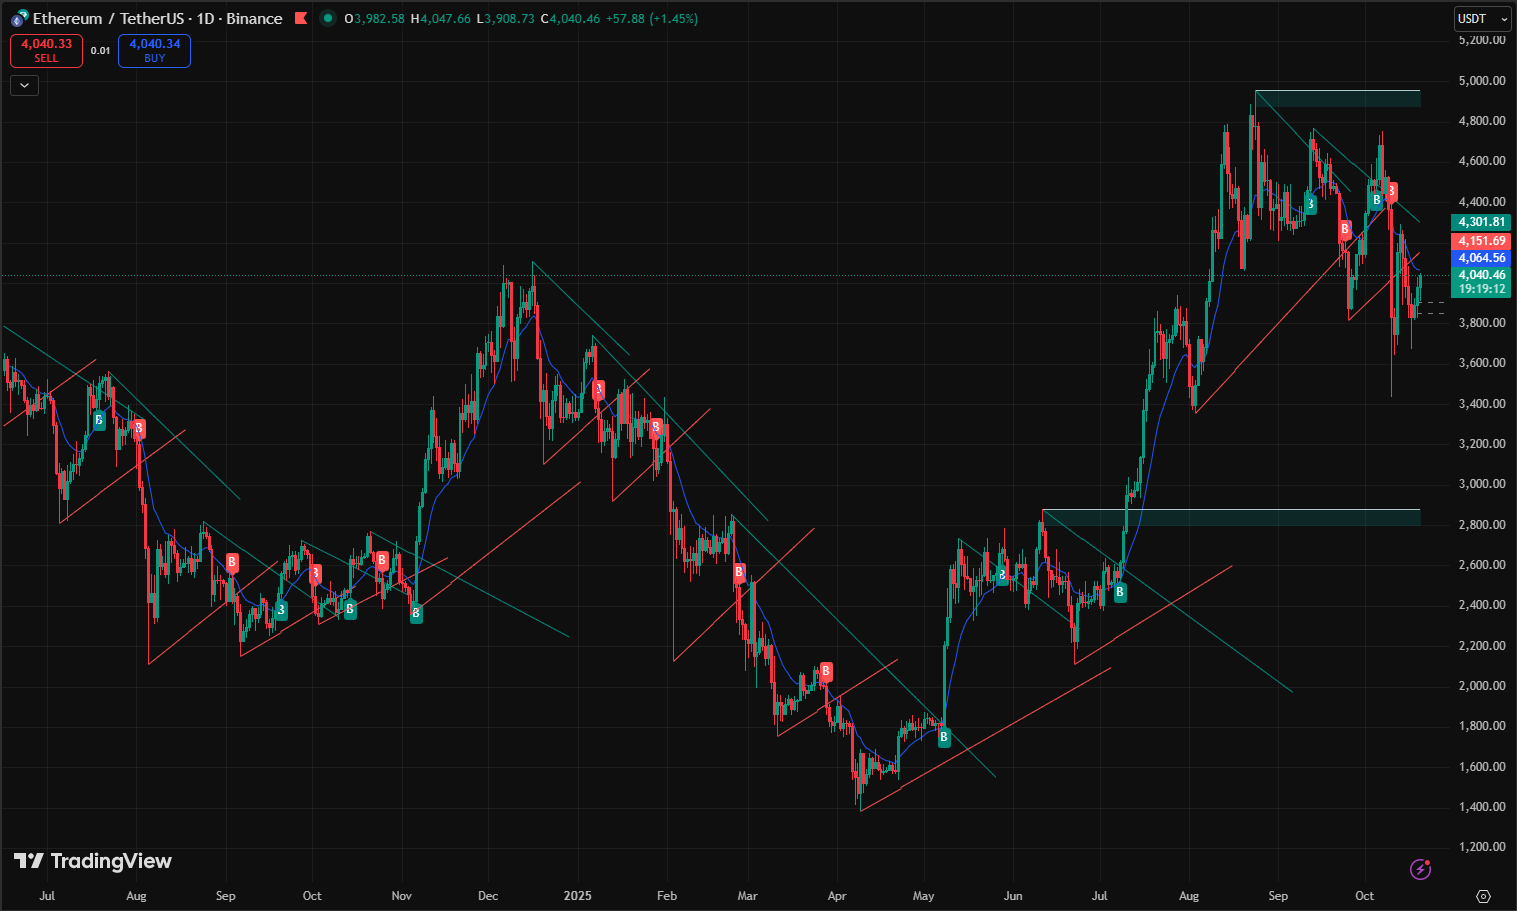
Shifting to Ethereum (ETH/USDT on Binance, Image 5: Daily chart at $4,040.46 +1.45%, in uptrend channel with symmetrical triangle potential). Ethereum is trading at $4,040.46, up 1.45%, moving inside a long-term ascending channel that has guided price action since early 2025. Despite sharp losses during the tariff crash, ETH respected its structural trendline from the June low near $3,200. The rebound from the $3,878 bottom confirmed strong buyer defense and restored short-term confidence.
The 50-day moving average around $4,100 now acts as a key resistance level, while the lower band near $3,900 provides solid support. A falling wedge is forming, with descending resistance gradually converging toward rising demand zones. Volume spiked 50% above average during the sell-off and stayed elevated through the rebound, suggesting accumulation rather than panic selling.
The RSI sits at 46, close to oversold territory but showing early signs of recovery. The MACD histogram remains negative yet is flattening, pointing to a slowdown in bearish momentum. Bollinger Bands have started to contract, hinting at a potential volatility squeeze. Historically, similar setups in 2021 and 2023 preceded 25–40% price expansions. On-chain data show network activity recovering and staking yields at 4.1%, with Layer-2 total value locked stabilizing near $43 billion after the brief outflows.
Possible Scenarios for ETH:
- Uptrend continuation: A confirmed move above $4,200 could trigger targets at $4,400–$4,600, supported by steady ETF inflows of $1.3 billion per week and renewed optimism around the Fusaka mainnet launch.
- Downtrend extension: A drop below $4,100 could bring a retest of $3,800 or even $3,600, especially if macro volatility increases or DeFi liquidations rise.
- Sideways range: Price may hover between $4,100 and $4,200 as the market digests tariff uncertainty and awaits clearer direction.
Overall Bias: Bullish medium-term. Ethereum’s dominance in smart contract activity (around 75%) and sustained ETF inflows continue to give it a fundamental advantage in any recovery phase.

For Solana (SOL/USDT on Binance, Image 6: Daily chart at $187.86 +2.05%, in rising channel since March with higher highs and lows). Solana is trading at $187.86, up 2.05%, and remains firmly within a rising channel that has defined its trend since March. The tariff-driven correction tested support around $180, where strong buying pressure emerged, leading to a swift rebound.
The price now trades between $180 support and $200–$210 resistance, forming a compact consolidation zone that reflects both profit-taking and renewed accumulation. RSI at 52 shows neutral momentum, while the MACD recently turned positive, confirming a mild bullish crossover. Bollinger Bands have expanded slightly, signaling a new volatility phase.
Volume analysis indicates balanced market participation. Despite a 5% decline in DeFi TVL to $13.5 billion, Solana’s ecosystem remains highly active, supported by 950,000 daily users and ongoing improvements from the Alpenglow upgrade, which has reduced network congestion by 40%.
Possible Scenarios for SOL:
- Uptrend continuation: A breakout above $190 could open a path toward $200–$220, aligning with prior post-correction rallies observed in 2021 that delivered over 150% gains during altcoin recoveries.
- Downtrend risk: A sustained break below $180 may lead to a correction toward $170, near the 200-day moving average, if sentiment weakens.
- Sideways range: Price could stabilize between $180 and $190 as investors consolidate positions in anticipation of broader market direction.
Overall Bias: Strongly bullish. Solana continues to outperform other Layer-1 networks with strong user retention, expanding developer activity, and a steady rise in ecosystem liquidity.
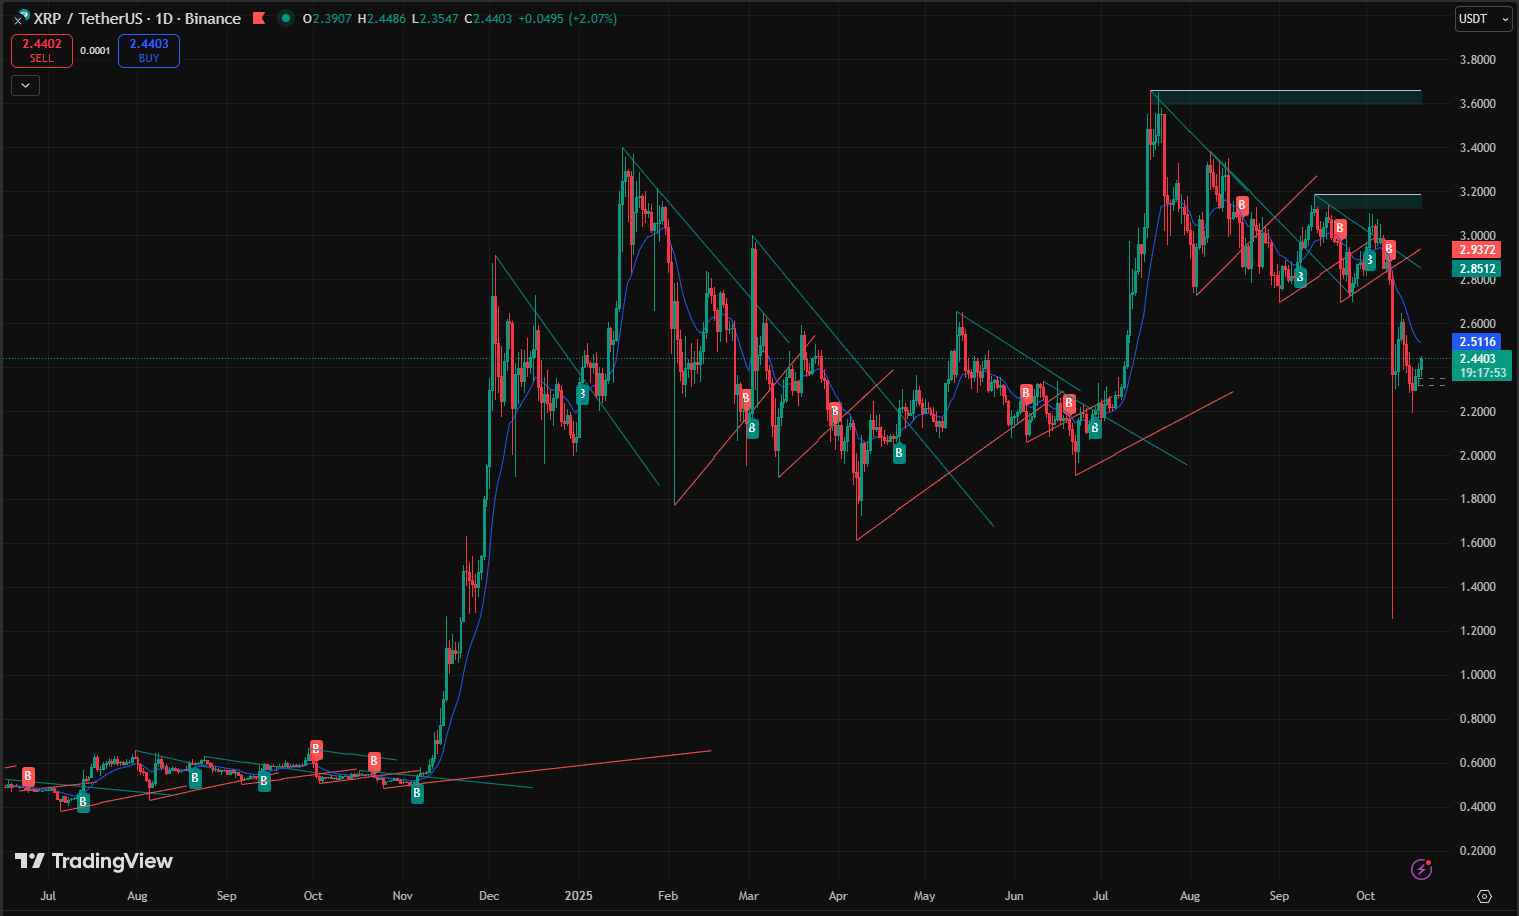
Finally, XRP (XRP/USDT on Binance, Image 7: Daily chart at $2.3903 -2.07%, in tight descending triangle from May highs). XRP is trading at $2.3903, down 2.07%, and remains locked in a tight consolidation range following months of lower highs. The price is currently fluctuating between $2.30 support and $2.70 resistance, forming a descending triangle structure that highlights indecision among traders.
During the tariff crash, XRP dropped to $2.30, where buying interest reappeared, keeping the range intact. Volume has remained muted since then, suggesting that market participants are waiting for a clear breakout signal. The RSI at 45 indicates neutral momentum, while the MACD is flat, reflecting a lack of short-term conviction.
Bollinger Bands have narrowed significantly, often a precursor to volatility expansion. Historically, similar contractions in 2021 and 2022 led to price swings of up to 50% once direction was established. Meanwhile, On-Demand Liquidity (ODL) usage continues to hold near $1.3 billion daily, showing consistent utility demand even through macro turbulence.
Possible Scenarios for XRP:
- Uptrend breakout: A decisive move above $2.70 could drive targets toward $2.90–$3.10, potentially fueled by renewed partnerships or positive developments in SWIFT integration and ETF speculation.
- Downtrend risk: A break below $2.30 could expose $2.10, reopening bearish momentum if broader market sentiment deteriorates.
- Sideways continuation: Consolidation between $2.30 and $2.70 may persist until a strong catalyst emerges.
Overall Bias: Neutral short-term, cautiously optimistic medium-term. XRP’s established infrastructure and cross-border use cases remain its strongest support pillars, positioning it for potential upside once volatility contracts and sentiment improves.
Institutional Inflows: How Crypto Liquidations Sparked Institutional Confidence
Institutional capital once again proved to be the market’s most reliable anchor amid the tariff-driven chaos. Net inflows reached $720 million for the week, slightly lower than the previous period but still marking the fourth consecutive week of positive activity—a clear signal of sustained institutional conviction despite heavy volatility.
BlackRock’s IBIT led with $420 million in Bitcoin additions, while ETHA brought in $300 million, reflecting a balanced strategy between BTC and ETH exposure even as spot prices swung 15–30%. Fidelity and Grayscale also added momentum, driving ETF revenues to $260 million annualized from Bitcoin and Ethereum products, further reinforcing the sector’s growing infrastructure maturity.
Corporate buyers continued to accumulate. Metaplanet expanded its holdings to 5,419 BTC, now worth roughly $632 million, viewing the crash as an ideal accumulation window and a hedge against inflation. Bitwise reported that institutions were purchasing Bitcoin at 3.5 times the mining rate, while on-chain data showed ETF wallets holding 520,000 BTC, a 5% increase despite the crash—a powerful indicator of long-term confidence.
Signals from traditional finance added more optimism. Vanguard’s potential return to crypto trading, hinted at by its CEO, points to a much broader institutional reentry that could unlock billions in new liquidity. Coinbase’s Brian Armstrong emphasized that upcoming market structure bills in the U.S. could further strengthen inflows by providing regulatory clarity.
According to Crypto.news, these institutional flows played a vital role in softening the $20 billion liquidation impact, preventing deeper losses and restoring stability faster than in previous crises. Venture funding also remained active: Zerohash raised $104 million to expand its infrastructure, and OranjeBTC announced its entry into Brazil, reflecting ongoing confidence in emerging markets despite global economic uncertainty.
Overall, institutions acted as the market’s stabilizing force during one of the most volatile weeks of the year. Their steady accumulation and growing ETF presence continue to position the sector for recovery and reinforce the narrative of crypto’s structural maturity.
Macroeconomic Backdrop: Global Tariffs and Crypto Liquidations Shape Market Sentiment
The defining event of the week was Donald Trump’s 100% tariff on Chinese imports, announced midweek. The news sent a shock through global markets, erasing $1 trillion from crypto’s total market cap in a single day and triggering $20 billion in liquidations, the largest on record.
Bitcoin dropped to $104,782.88, while Ethereum and other major altcoins lost between 15 and 30%, mirroring sharp declines in U.S. equities. The S&P 500 fell 0.8%, and the Nasdaq followed closely behind, highlighting how closely crypto now moves with broader markets.
Amid the chaos, several macro signals helped steady sentiment. The Federal Reserve’s 50 basis-point rate cut and CPI at 2.4%, below expectations, eased fears of stagflation. Unemployment held at 4.1%, and wage growth remained moderate, suggesting a balanced labor environment. China’s stimulus added a short-term boost, though the U.S. dollar index climbed to 98.2, keeping global liquidity tight.
Gold surged to $4,370 per ounce, prompting Michael Saylor to describe Bitcoin as the stronger long-term inflation hedge. Despite the volatility, Bitcoin’s trend channel stayed intact through the CPI release. Correlation between BTC and U.S. equities rose to 0.75, showing that global risk sentiment now plays a greater role in crypto price action.
Political factors also helped sentiment recover slightly. Data from Polymarket showed the odds of a U.S. government shutdown falling to 77%, allowing markets to breathe by the week’s end. Even with persistent uncertainty, crypto’s borderless and decentralized nature continued to stand out. Stablecoin issuance surpassed $300 billion, proving the sector’s ability to function through stress. Analysts from FxPro said that if trade tensions cool, Bitcoin could still rally to $130,000 before the end of the year.
Policy Wins: Regulatory Progress Amid Market Chaos
While volatility dominated headlines, regulatory progress quietly reshaped the landscape. Grayscale received approval for its multi-crypto ETFs, marking another step toward institutional legitimacy. In the NFT space, Bored Ape Yacht Club collections were officially ruled non-securities, lifting confidence across digital asset markets.
The week also brought momentum for stablecoins. Tether launched USAT, expanding its presence in the U.S., while Shiba Inu introduced a new stablecoin to strengthen its ecosystem. In Asia, Kazakhstan’s Evo project partnered with Solana and Mastercard, and Naver took control of Upbit, confirming South Korea’s position as a dominant trading hub.
Other initiatives showed how deeply blockchain is integrating into global finance. SWIFT advanced its XRP pilot, targeting $5 trillion in annual settlements, and Google’s Layer-1 blockchain surpassed 600,000 active users. The UK–U.S. regulatory taskforce continued aligning frameworks, and the European Union pushed forward its digital euro project.
Token2049 drew 25,000 attendees, highlighting Asia’s central role in crypto growth, while MoonPay rolled out AI-based payment tools for smoother digital transactions. The Crypto Council noted that these advancements collectively strengthen industry credibility, and Coinbase’s Brian Armstrong said that upcoming U.S. market structure bills could accelerate adoption once enacted.
Ethereum's Resurgence and Flippening Debate
Ethereum showed quiet strength throughout the turmoil, holding near $4,100 while absorbing market-wide selling pressure. Strong ETF inflows of $300 million and rising staking participation, now at 29.5 million ETH, helped support price stability.
Momentum built further as Fusaka’s Holesky testnet completed successfully, paving the way for a mainnet launch in December. Analysts like Tom Lee raised their Q4 price target to $7,500, while the ETH/BTC ratio of 0.036 could climb to 0.09, suggesting a potential path toward $10,000 ETH if conditions improve.
Industry leaders reinforced the narrative. Joseph Lubin emphasized Ethereum’s expanding real-world utility, Chainlink announced a $1.3 million treasury expansion, and TRON processed $620 billion in stablecoin volume, underlining the network’s influence. The Privacy and Security Engineering team also unveiled a new 2026 roadmap focused on scalability and privacy, reigniting debates over whether Ethereum could eventually challenge Bitcoin’s dominance.
Bitcoin's 4-Year Cycle: Tested but Intact Post-Crash
Despite the $20 billion liquidation event, Bitcoin’s four-year cycle appears to remain intact. According to ETF strategist Matt Hougan, institutional participation through ETFs has reduced extreme volatility while preserving the long-term rhythm of halving-driven rallies.
A survey of market analysts showed that 62% still believe the current cycle is following previous patterns, with a mid-cycle correction setting up a potential Q4 surge. Charts from multiple trading desks mirror earlier cycles, pointing to possible highs between $130,000 and $140,000 before year-end.
On-chain trends confirm the same story. Long-term holder accumulation remains strong, while Hyperliquid’s 45% HYPE token burn added fuel to Bitcoin’s scarcity narrative. Despite near-term uncertainty, the underlying structure of the bull market remains resilient, signaling that this correction is a test, not an ending.
Other News: Airdrops, Security Issues, and Ecosystem Advances
The broader crypto ecosystem remained active despite the volatility. Gemini filed for a $5 billion IPO, and Polymarket hit $10 billion in total trading volume driven by election-related activity. On the security side, Shibarium patched a $2.4 million exploit, and the UXLINK hack costing $11.3 million led to new investigations into insider trading behavior.
Development across major ecosystems continued at pace. Solana’s Alpenglow upgrade reduced network congestion by 40%, while Jupiter reached $130 million TVL, and Base processed 1.3 million trades in a single week. BNB Chain climbed to 56.4 million monthly active users, overtaking Solana for the top spot in network activity.
Airdrop events continued to dominate community attention. Aster’s $680 million airdrop on October 14 drew widespread participation, followed by new campaigns from Solstice, MetaMask LINEA rewards, and Sonic, which approached a technical breakout. Privacy-focused coins such as ZEC, DASH, and XMR rallied 8 to 15% after the NFT non-security ruling renewed confidence in decentralized assets.
New launches added further momentum. Tether expanded USAT, China introduced its CNH stablecoin, and Plasma’s XPL token debuted with a $15 billion valuation and $2 billion liquidity. Kresus released smart wallets with mini-app integrations, while Monad’s airdrop tracking tools surged in usage as DeFi farming regained traction.
At the infrastructure level, stablecoin transactions surpassed Visa’s Q1 payment volume of $6 trillion, showing how blockchain is steadily integrating into real-world finance. Despite the week’s shocks, venture activity stayed strong with new funding from Zerohash and OranjeBTC, proving that innovation in crypto continues even in the toughest market conditions.
Conclusion: Resilience After Massive Crypto Liquidations
The week’s turmoil revealed how far crypto has matured. The market lost $1 trillion in value and saw $20 billion in liquidations, yet stability returned within days. Institutional inflows of $720 million, strong ETF revenues, and corporate accumulation such as Metaplanet’s $632 million Bitcoin buy helped rebuild confidence.
Macro conditions offered some relief as Fed rate cuts and low CPI offset tariff pressure, while policy progress, from Grayscale’s ETF approvals to Vanguard’s shift toward crypto, signaled growing legitimacy. New launches like Tether USAT, Shiba stablecoin, and Plasma’s $15 billion ecosystem showed that innovation never paused.
Growth across ecosystems continued: Ethereum’s Fusaka, Solana’s Alpenglow, BNB’s user surge, and Monad’s airdrop boom all added momentum. Gemini’s IPO, Zerohash’s $104 million raise, and OranjeBTC’s Brazil expansion proved investor confidence remains strong.
With Bitcoin holding above $112,000 and Ethereum near $4,000, the market’s foundation appears solid. Analysts expect $130,000 BTC and 20–50% altcoin rebounds if trade tensions ease. Despite the turbulence, the message is clear: crypto’s resilience has become its greatest strength, setting the stage for renewed growth into year-end.