Crypto Weekly Recap: September 1–8, 2025
A Week of Bearish Pressures and Selective Resilience
The cryptocurrency market from September 1-8, 2025, embodied the infamous "Red September" curse, with total capitalization sliding from $3.82 trillion to $3.83 trillion amid heightened volatility and $44 billion in 24-hour losses at one point. Bitcoin (BTC) dipped to $107,000 before recovering slightly to $110,681, down 0.8% weekly, while Ethereum (ETH) fell harder to $4,283, off 2.5%. Altcoins showed mixed results: Solana (SOL) gained 2.09% to $206.48, buoyed by ecosystem developments, and XRP rose 1.75% to $2.8686 on regulatory hopes. Trading volume averaged $88.75 billion, with the Fear and Greed Index at 42 (Neutral), reflecting caution amid $453 million in token unlocks flooding liquidity. Key themes included macro data like U.S. job reports missing estimates, prompting rate-cut bets at 85%, and policy shifts like Trump's American Bitcoin initiative aiming for Nasdaq listing. This recap delves into how unlocks, whale rotations, and on-chain metrics signal a potential bottom, contrasting with September's historical -6% average returns. Paradoxically, Bitcoin adoption indices topped by India and the U.S. underscore long-term growth amid short-term pain.
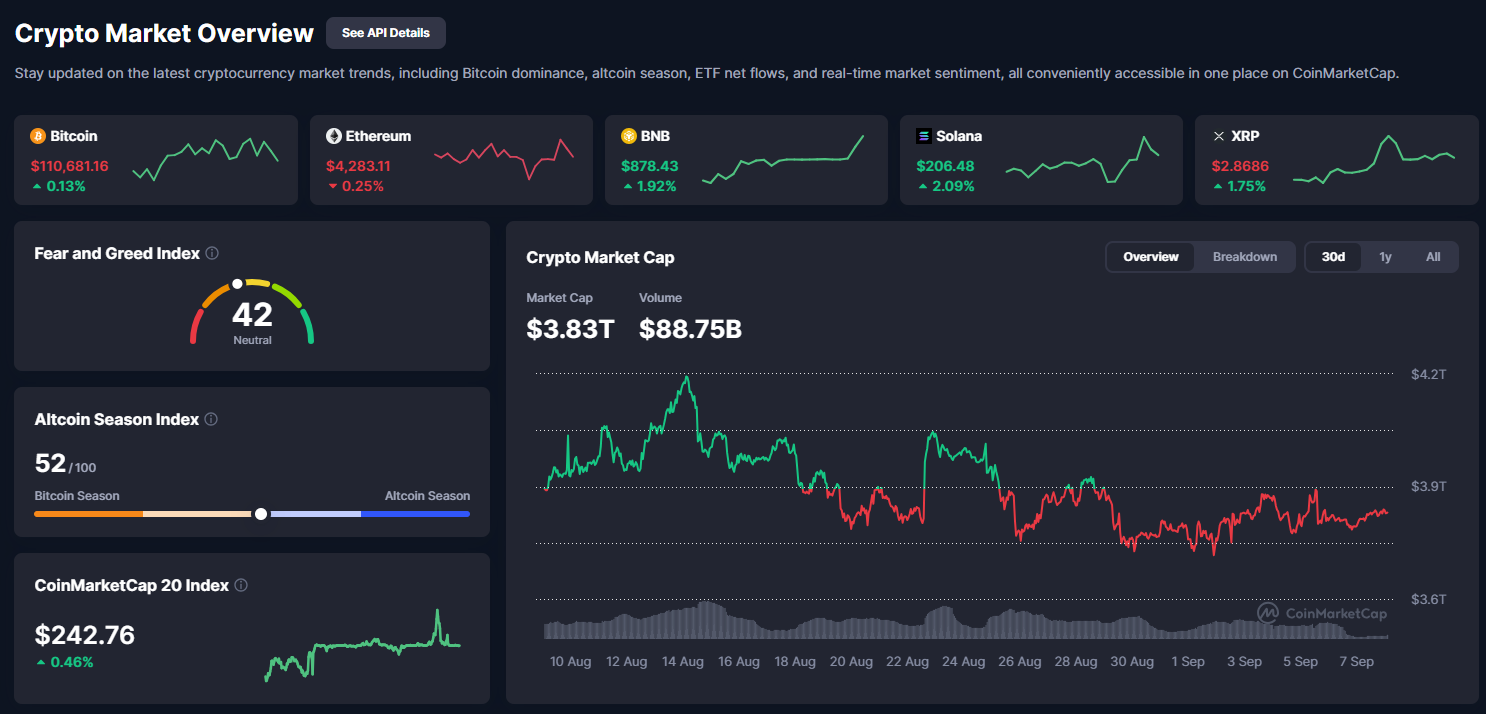
From CoinMarketCap snapshots, the market cap chart (Image 1: Crypto Market Overview dashboard displaying total cap at $3.83T, volume $88.75B, Fear & Greed at 42, Altcoin Season Index at 52, and CoinMarketCap 20 Index at $242.76 +0.46%) shows a volatile week with dips testing $3.7T support before rebounding, indicative of liquidation cascades. On-chain data reveals reduced selling pressure, with stablecoin inflows (USDC projected 40% annual growth) positioning crypto as a hedge against softening equities. While MVRV ratios dip below 2.0, suggesting undervaluation, metrics like NUPL above 0.4 hint at untapped upside despite the bloodbath.
Analysis of Crypto Total Market Cap and Indices
The CoinMarketCap overview (Image 1: Dashboard highlighting market cap $3.83T up 0.67% daily, but weekly declines, with top tokens like BTC +0.13%, ETH -0.25%, BNB +1.92%, SOL +2.09%, XRP +1.75%) captures a neutral sentiment, with volume spikes during sell-offs indicating forced liquidations. The capchart illustrates a sharp mid-week drop from August highs, forming potential higher lows near $3.7T, with decreasing volatility suggesting a coiling spring for expansion.
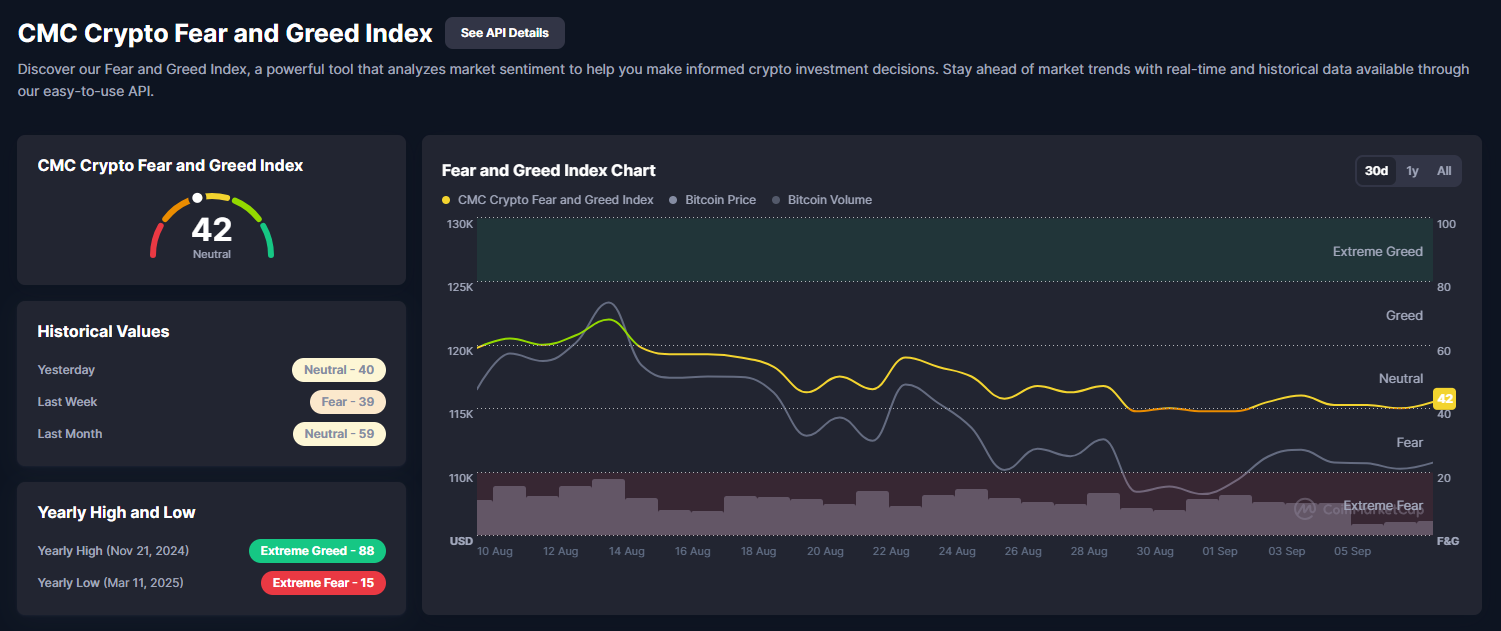
The CMC Crypto Fear and Greed Index at 42 (Neutral) (Image 2: Fear and Greed Index chart with current 42, historical: yesterday 40, last week 39, last month 59) shows a slide from Greed, overlaying BTC price dips with thinning volume. This neutral band often precedes rebounds, as in past Septembers where 40-50 readings marked 15-25% gains by October.
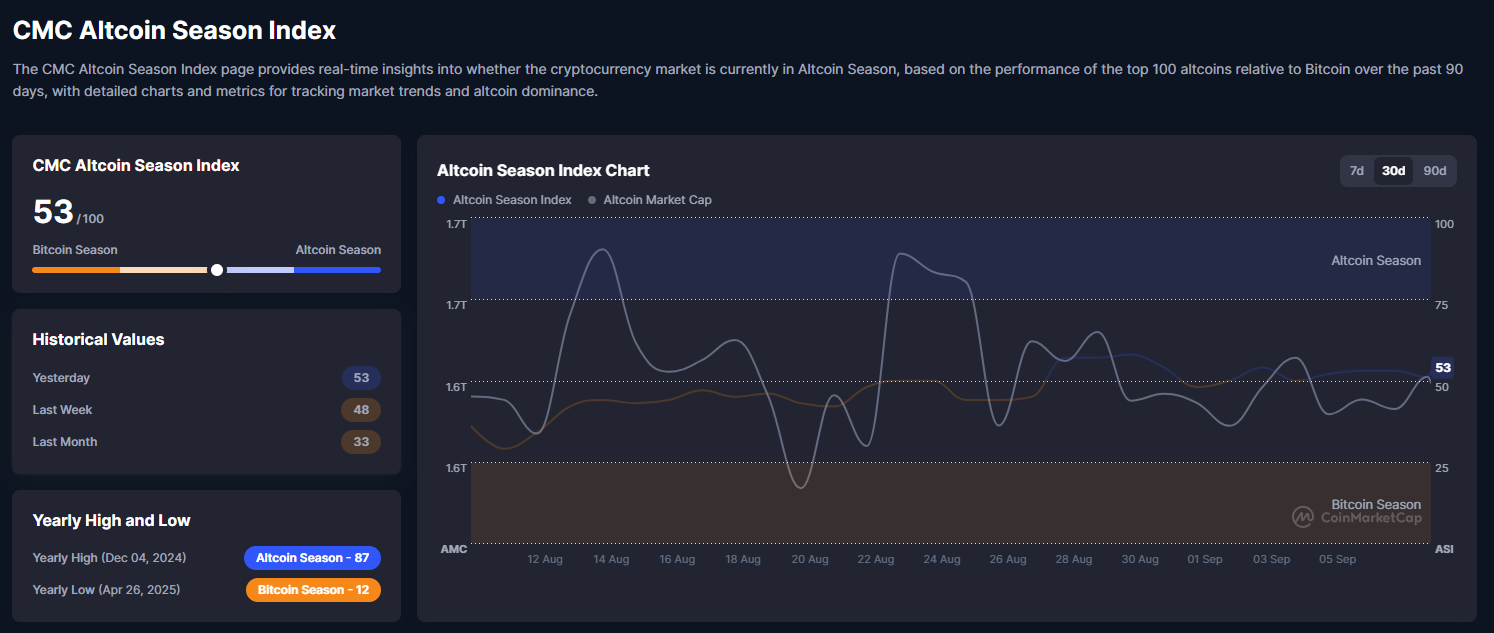
The CMC Altcoin Season Index at 53/100 (Image 3: Altcoin Season Index chart at 53, historical: yesterday 53, last week 48, last month 33) edges toward alt dominance, up from 33 last month, with alt cap volatility aligning to SOL/XRP gains. Breaching 75 could spark a full alt season, echoing 2021 rotations.
Technical Analysis and Outlook for Key Tokens
Dissected the latest charts from TradingView and CoinMarketCap data as of September 8, 2025. The overall market sentiment leans neutral-to-bearish, with the Fear and Greed Index at 42 signaling caution amid macroeconomic uncertainties like Fed rate decisions and global trade worries. Bitcoin dominance holds around 57%, but the Altcoin Season Index climbing to 53 suggests subtle rotation potential, where alts could outperform if stabilizing BTCs. Here, we will break down the technical setups for BTC, ETH, SOL, and XRP, incorporating price action, key indicators like RSI and moving averages, volume profiles, and pattern analysis. We will also outline probable scenarios—uptrend continuations, downtrend risks, sideways consolidations, or high-volatility breaks—backed by historical parallels and on-chain corroboration where relevant. This analysis assumes no major black swan events, focusing on probabilistic outcomes based on current formations.
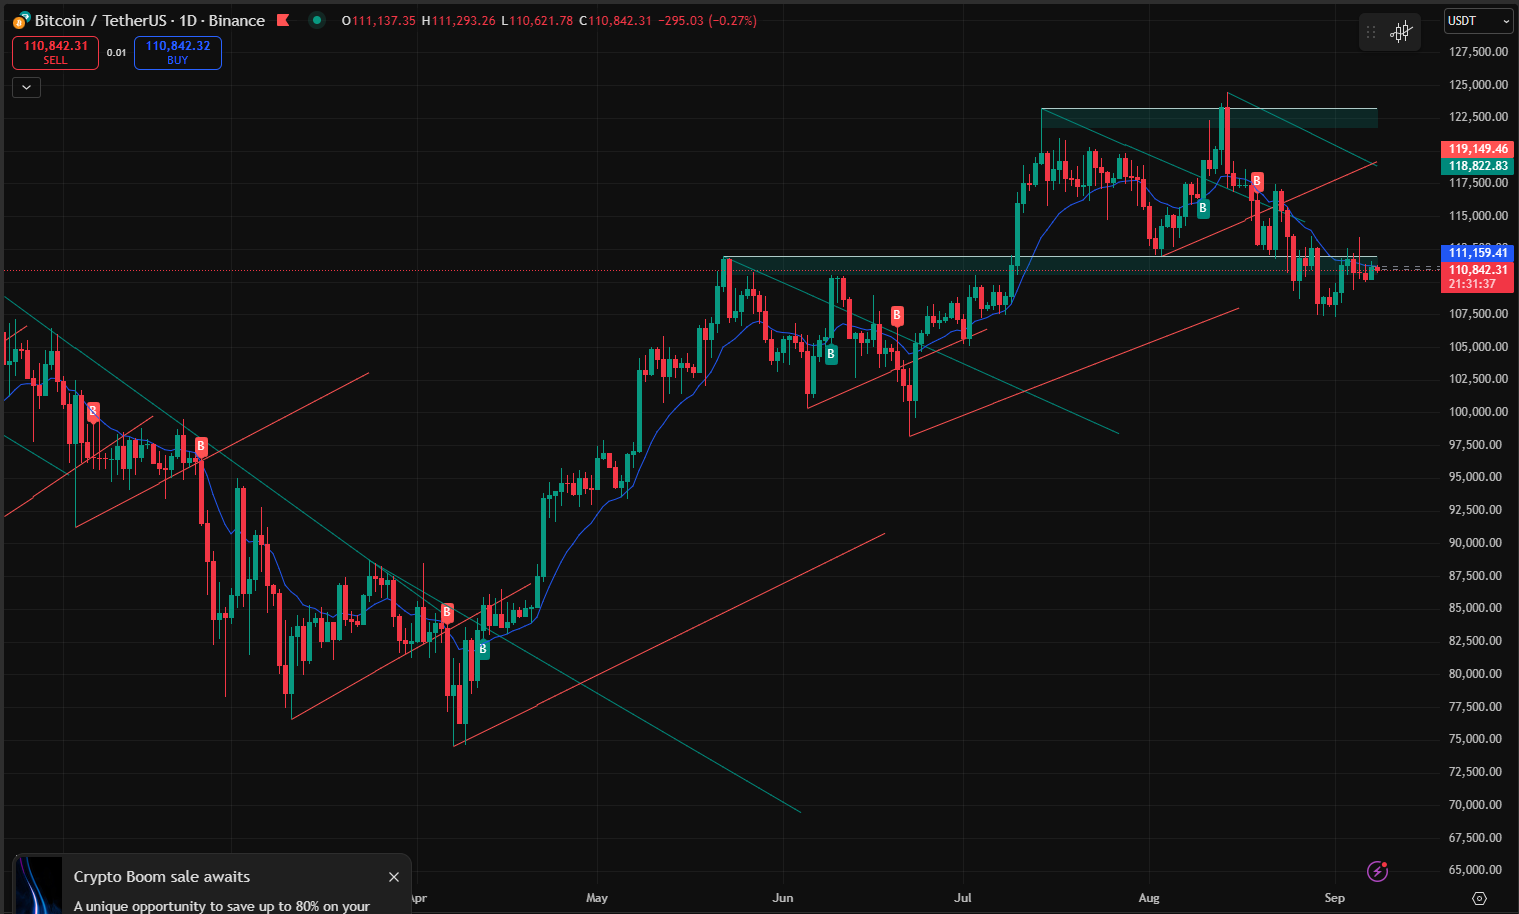
Starting with Bitcoin (BTC/USDT on Binance, Image 4: Daily chart showing price at $111,137.35 down 0.27%, within an ascending channel from February 2025 lows). BTC's structure remains bullish on higher timeframes, trading in an uptrend channel with the lower boundary around $108,500 acting as dynamic support—recently tested during the early-September dip without breakdown. The price has formed higher lows since the mid-July dip near $96,000, but recent action shows consolidation below the 50-day moving average (MA) at approximately $113,000, which now caps as resistance. A descending wedge pattern is evident from mid-July highs, with converging red resistance lines and teal support, labeled with buy ("B") signals at bounces like the late-August low at $108,500 and a sell ("S") at the July peak around $120,000. Volume has tapered during this pullback, typical of bull flags or pennants, suggesting accumulation rather than distribution. The RSI hovers at 48, neutral and diverging bullishly from price lows, indicating fading downside momentum. Bollinger Bands are narrowing, a classic precursor to volatility expansion.
Possible scenarios for BTC: In an uptrend resumption, a sustained break above $113,000 (50-day MA) could target the channel top near $118,000-$120,000, filling potential CME gaps and eyeing all-time highs beyond $124,000 if institutional inflows resume post-September unlocks.
Historical cycles post-halving (like 2021) show similar mid-cycle corrections leading to 50-100% rallies, supported by on-chain metrics like NUPL above 0.5. Conversely, a downtrend acceleration below $108,500 might retest the 200-day MA around $100,000 or even $96,000, exacerbated by high leverage (open interest at $38B) triggering liquidations—watch for $200B wipeouts as in August. Sideways action seems probable short-term, ranging $108,500-$113,000 with moderate volatility (±3-5% daily swings), ideal for scalpers but risky for longs amid September's bearish seasonality (average -6% returns historically). High volatility could spike if Fed cuts disappoint, pushing BTC toward $105,000. Overall bias: Mildly bullish if holds support, with risk-reward favoring longs on dips.
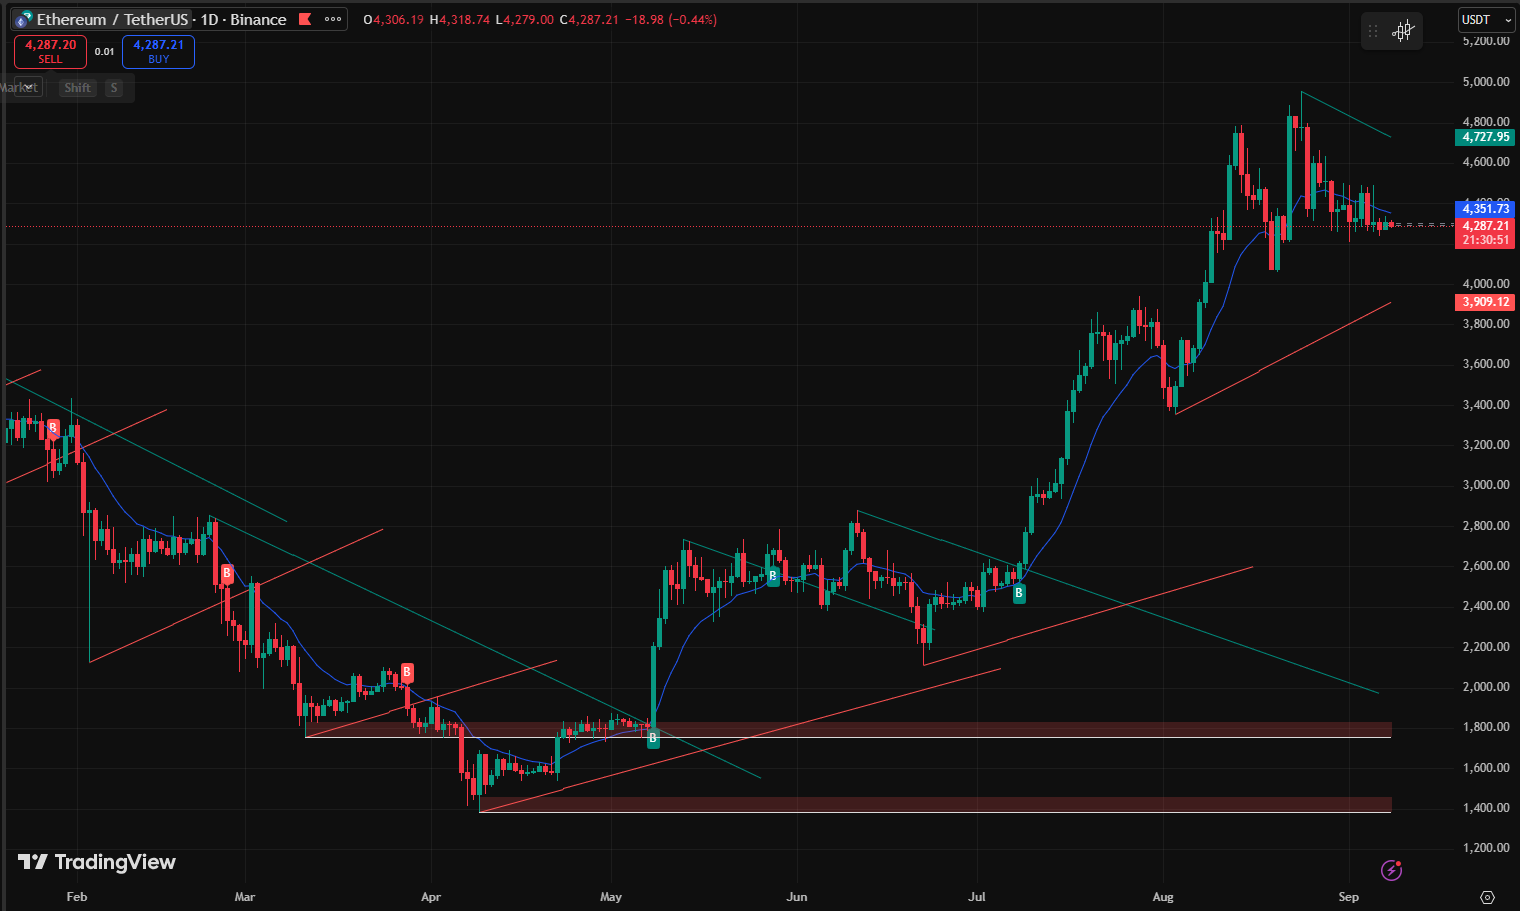
Shifting to Ethereum (ETH/USDT on Binance, Image 5: Daily chart at $4,306.19 down 0.44%, in a symmetrical triangle breakout phase from April lows). ETH has shown relative strength earlier in August, surging past $4,000 to a new ATH near $4,945, but the current pullback tests the uptrend's integrity. The chart reveals a strong ascending trendline from the June low around $3,200, with multiple "B" buy signals at supports like $4,200 (mid-August bounce) and a "S" sell at the recent high. Price respects the 50-day MA at $4,470 as prior resistance-turned-support, but the recent dip below it signals short-term weakness. A descending red trendline from the ATH caps upside, converging with teal support in a potential falling wedge. Volume spiked on the downside move, but RSI at 52 remains above oversold (30), with bullish divergence emerging as MACD histogram flattens. Bollinger Bands contract, hinting at an imminent squeeze—historically, ETH volatility expands 20-30% post-consolidation.
Outlook scenarios: Uptrend continuation is favored if ETH reclaims $4,500, targeting $5,000-$6,000, driven by ETF inflows (record $461M in August) and staking yields attracting institutions. The ETH/BTC ratio at 0.039 could climb to 0.085 (2021 peak), implying $10,000+ ETH at current BTC levels, per analysts like Tom Lee. Downtrend risks loom if breaks $4,200, eyeing $3,800 (100-day MA) or $3,500, amplified by high volatility from options (implied vol at 65%) and DeFi liquidations. Sideways consolidation in $4,200-$4,500 range could persist if macro data like PCE inflation softens sentiment, allowing for alt rotation. High volatility is likely near-term, with ±5-7% swings on news catalysts like SEC staking approvals. Bias: Bullish medium-term, as ETH's utility in DeFi and NFTs provides edge over BTC in risk-on environments.
For Solana (SOL/USDT on Binance, Image 6: Daily chart at $206.35 down 0.16%, in a rising channel with higher highs/lows since March). SOL stands out as a resilient alt, uptrending despite broader market dips, thanks to ecosystem growth like pump.fun and DeFi TVL hitting $5B. The chart shows an ascending channel with lower support at $195 (recent test) and upper resistance near $210-$220. Multiple "B" buys along the trendline, including August lows at $186, contrast with "S" sells at peaks like $211. Price action forms a bull flag post-July surge, with RSI at 58 indicating sustained momentum without overbought signals (above 70). Volume supports upmoves, and MACD crossover bullish, while Bollinger Bands widen slightly, suggesting expanding volatility.
Scenarios: Uptrend momentum could propel SOL above $210 to $250-$300, fueled by VanEck ETF filings and network upgrades reducing congestion. Historical parallels to 2021 (300% rally post-alt season start) align with current Altcoin Index at 53. Downtrend if loses $195, targeting $180 or $170 (200-day MA), with high volatility from memecoin hype (±10% daily). Sideways in $195-$210 is possible if BTC drags, but SOL's 4.7% outperformance signals decoupling potential. Bias: Strongly bullish, positioning SOL as an alt leader.
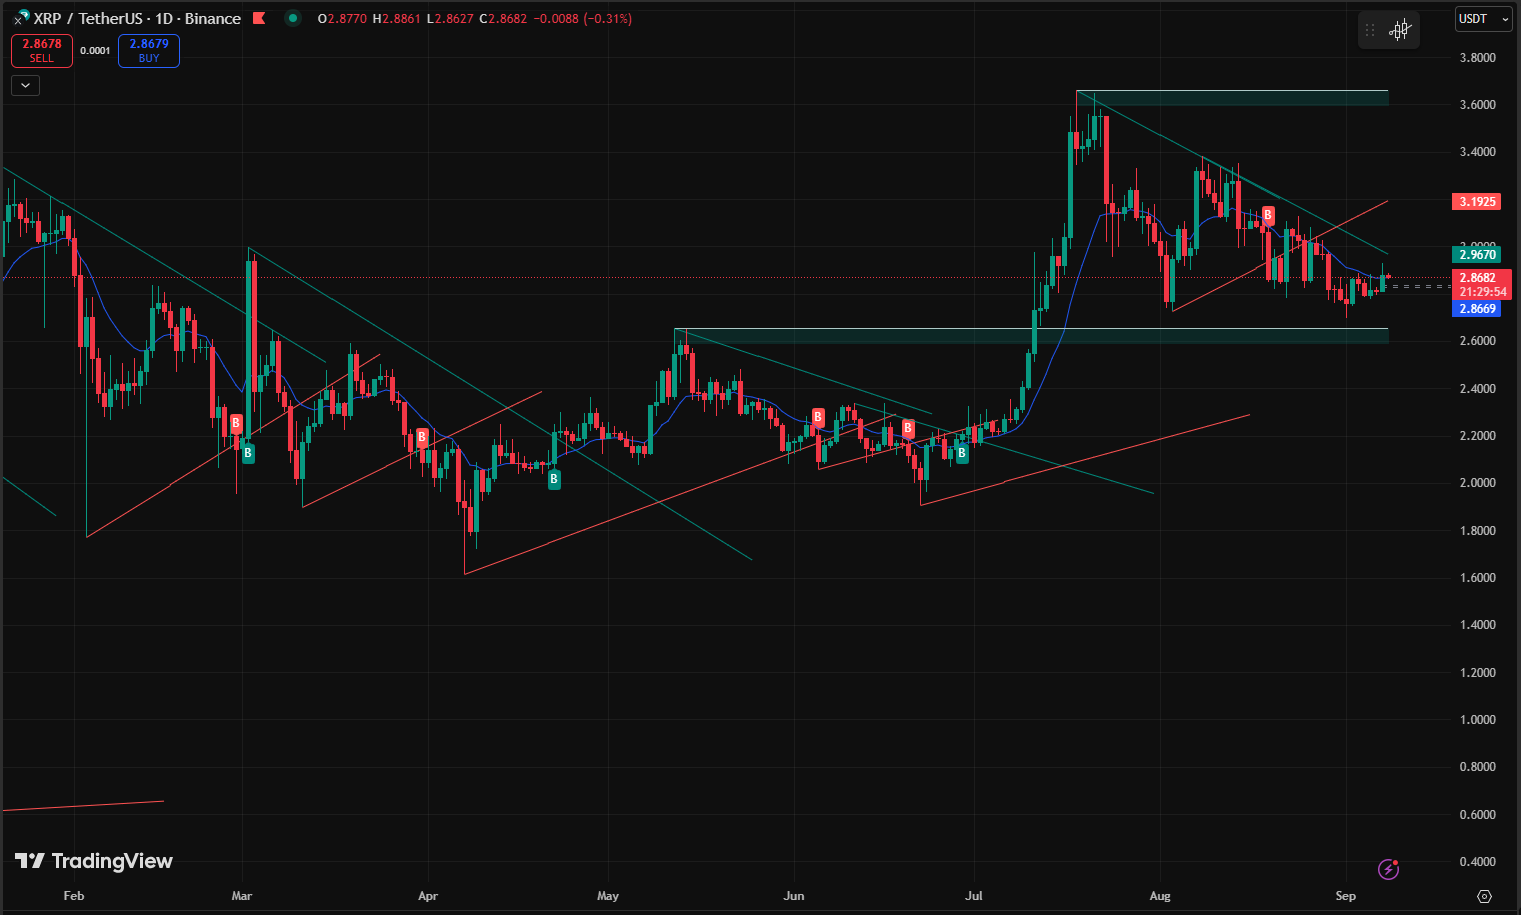
Finally, XRP (XRP/USDT on Binance, Image 7: Daily chart at $2.8770 down 0.31%, in a tight descending triangle from May highs). XRP remains range-bound, consolidating between $2.70 support and $3.00 resistance, with a descending red trendline capping gains. "B" buys at lows like $2.70 and "S" at $3.11 highlight indecision, RSI at 48 neutral, low volume indicating lack of conviction. Bollinger Bands narrow, prelude to breakout.
Outlook: Uptrend breakout above $3.00 could target $3.50-$4.00 on ETF approvals or SWIFT integrations. Downtrend below $2.70 to $2.50 if regulatory hurdles persist. Sideways likely, with low volatility unless catalysts emerge. Bias: Neutral, watching for volume spikes.
In summary, the market favors selective plays: BTC and ETH for stability, SOL for growth, XRP for catalysts. Risk management is key amid volatility.
Institutional Inflows: Divergence Amid Unlocks
Spot ETFs diverged: BTC saw $301M outflows in early September, while ETH netted +$3.95B YTD, BlackRock's ETHA leading with $314M. Institutions accumulated BTC 4x mining rate, per Bitwise, with pensions like Michigan expanding ARKB holdings. Corporates added BTC reserves, echoing Harvard's $116M in IBIT. These flows, despite $4.5B unlocks, align with chart supports, RSI neutrality signaling dip-buying.
Macroeconomic Backdrop: Job Misses Fuel Cut Bets /U.S. August jobs added only 142K vs. 161K expected, unemployment at 4.2%, boosting September cut odds to 85%. PCE inflation at 0.3% MoM supported dovishness, weakening DXY to 98. Tariffs on chips/gold elevated prices, Saylor pushing BTC as "digital gold." BTC held channel lows during sell-offs, 200-day MA at $80,000 as ultimate floor.
Policy Wins: Trump Initiatives and Regulatory Pivots
Trump's American Bitcoin, backed by sons, targets Nasdaq listing in September, raising $25M. Orders enabled crypto in retirements, probing bank discrimination. SEC softened staking, aiding ETH
SOL; Brazil debated BTC reserves; SWIFT tested XRP. Google's L1 blockchain for enterprises marked adoption.
Ethereum's Resurgence and Flippening Debate
ETH briefly hit $4,955, retreating on unlocks, but forecasts eye $7,500 by year-end. ETH/BTC at 0.039 targets 0.085 ($10,000 ETH). Lubin reiterated flippening. Chainlink's treasury hit $1M+; TRON $600B stablecoins.
Bitcoin's 4-Year Cycle: Tested by ETFs
Hougan claims ETFs dampen winters, but polls affirm cycle persistence. Chart parallels post-halving: surge, correction, uptrend to $150K-$160K late-2025.
Other News: VanEck SOL ETF push; Coinbase Base DEX; Aave RWA market; Jupiter Lend. Spam debates on Bitcoin network.
Conclusion: Navigating Red September's Storm
This week hammered markets with unlocks and macros, but alts' resilience and policy tailwinds lay rally foundations. BTC may range $108K-$113K, upside to $118K if holds; bearish sub-$108K. ETH $4,800+, SOL $250, XRP sideways pre-catalysts. Ahead: CPI, Fed; $4.5B unlocks. A bottoming phase for fundamentals-driven buys.