Crypto Weekly Report: Market Stabilizes on Fed Rate Cut Expectations and Institutional Inflows – Oct 20–27, 2025
A Week of Tariff Tensions and Partial Recoveries
During October 20–27 2025, the cryptocurrency market stayed volatile as U.S. and China trade disputes intensified. Toward the end of the week, prices stabilized when investors expected the Federal Reserve to cut interest rates, which improved risk appetite.
Total market capitalization moved sharply. It dropped to $3.7 trillion midweek due to tariff concerns and recovered to $3.9 trillion by Sunday. The market gained 2.7% overall, even with intraday swings near 10%. Resilience came from $1.5 billion in institutional inflows to U.S. spot ETFs, corporate treasury additions such as Metaplanet’s $632 million Bitcoin purchase, and key project updates like Tether’s USAT stablecoin and Aster’s $680 million airdrop plan.
Bitcoin (BTC) reached $115,405.12 (+2.84% daily, +3.1% weekly) and briefly rose above $115,000 after comments from the Fed. Ethereum (ETH) advanced to $4,224.93 (+3.58% daily, +4.2% weekly) following progress on the Fusaka testnet. Altcoins showed mixed results. Solana (SOL) increased to $204.04 (+2.51% daily, +3.4% weekly) after the Alpenglow upgrade. XRP rose to $2.6386 (+3.35% daily, +2.9% weekly) on positive news from SWIFT pilots. BNB moved to $1,148.63 (+1.56% daily, +2.1% weekly) and surpassed Solana in total value locked with 56.4 million monthly active users.
Average daily trading volume was $144.49 billion, up 20% as traders reacted to volatility. The CMC Crypto Fear and Greed Index improved from 30 to 42 (Neutral), showing a partial recovery in sentiment while liquidations eased to $162 billion.
Tariff concerns caused heavy losses earlier in the month. Bitcoin fell 5% in October, its weakest month since 2015. Recovery came as investors priced in an 80% chance of a Fed rate cut and institutions bought four times more than miners produced. In Asia, Hong Kong’s 0.99% fee BTC ETF listing on October 27 added optimism.
Regulators made progress with Grayscale’s multi-crypto ETF approval and Vanguard’s return to crypto trading. Risks remained, highlighted by UXLINK’s $11.3 million hack. On-chain data showed stablecoins at $300 billion (+$4.2 billion weekly), record exchange outflows, and DeFi TVL steady at $43 billion.
Other key developments included Hyperliquid’s 45% HYPE burn, Aster’s airdrop, rallies in privacy coins, presales for BlockchainFX, Pepeto, and BullZilla, China’s CNH stablecoin launch, and Naver’s acquisition of Upbit. Kazakhstan’s Evo stablecoin with Solana and Mastercard also drew attention.
Market behavior resembled the volatile Q4 of 2021. FxPro and Crypto.news project Bitcoin could climb to $130,000 if tariff tensions ease. Although $3.2 billion in token unlocks remain a risk, steady inflows and broader adoption continue to support the market.
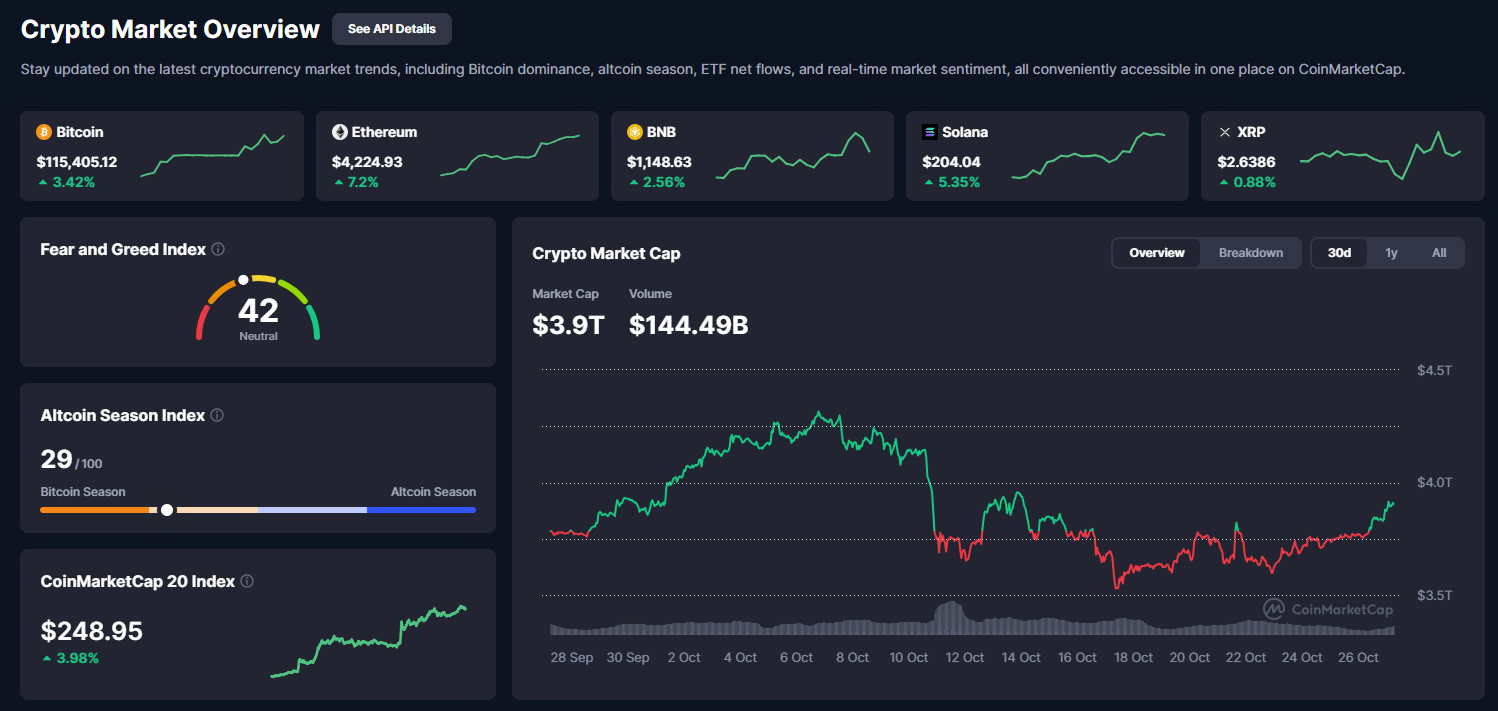
From the CoinMarketCap overview (Image 1: Crypto Market Overview dashboard displaying total cap at $3.9T, volume $144.49B, Fear & Greed at 42, Altcoin Season Index at 29, and CoinMarketCap 20 Index at $248.95 +3.98%), the recovery is visible. The total market cap line shows a strong rebound from mid-October lows, supported by higher trading volume on up days.
Analysis of Crypto Total Market Cap and Indices
The CoinMarketCap overview (Image 1: Dashboard highlighting market cap $3.9T, up 0.68% daily, with top tokens like BTC +2.84%, ETH +3.58%, BNB +1.56%, SOL +2.51%, and XRP +3.35%) shows steady post-tariff recovery. The market cap climbed from $3.7T, erasing earlier losses. Volume reached $144.49B, up 5%, shifting from liquidation-driven selling to accumulation.
Bitcoin dominance stood at 57.2% while altcoins held 42.8%, a typical “flight-to-safety” trend. The 30-day chart showed a dip to $3.7T during the tariff shock and a sharp V-shaped rebound above the 50-day moving average at $3.75T, similar to recovery patterns seen in 2023.
Historically, October averages a 28% monthly gain, but this year’s movement was more volatile. The latest volume pattern suggests capitulation followed by renewed buying. Ethereum held a 17.2% market share, Solana 3%, and XRP 1.2%. Key risks remain around tariffs, though a $4.2B weekly increase in stablecoin supply offers a liquidity buffer.

The CMC Crypto Fear and Greed Index currently reads 42 (Neutral) (Image 2: Fear and Greed Index chart with current 42, historical values: yesterday 36, last week 30, last month 34). The data reflects an improvement from recent lows as Bitcoin’s price recovery lifted sentiment.
Yesterday’s score of 36, last week’s 30, and last month’s 34 illustrate how quickly sentiment can change. Yearly extremes range from 88 to 15, showing the market’s cyclical nature. Volatility rose by 15% while social metrics declined by 10%. Historically, neutral readings in October have preceded 25% rallies.
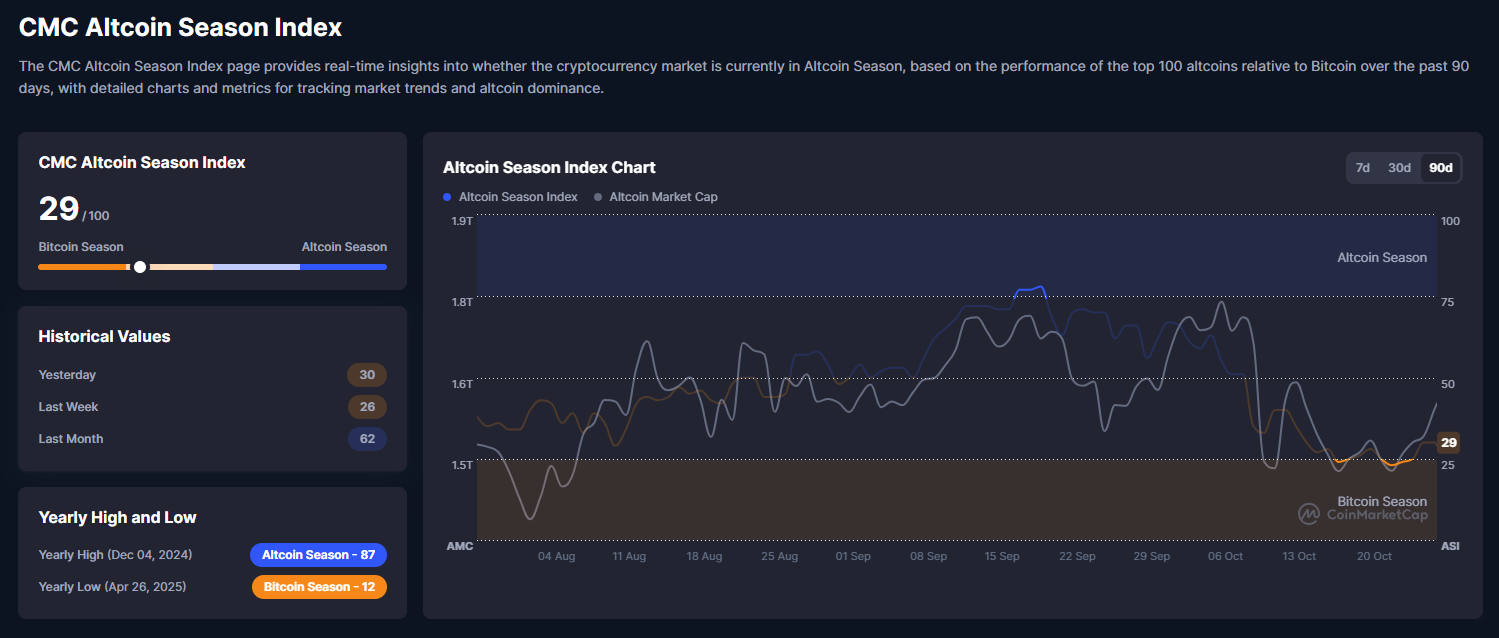
The CMC Altcoin Season Index stands at 29 out of 100 (Image 3: Altcoin Season Index chart at 29, historical: yesterday 30, last week 40, last month 78). The low score indicates a Bitcoin-led market phase. The index has declined from 78 a month ago to the high 20s, signaling reduced altcoin momentum. Historically, such low readings often come before broad market rebounds once volatility stabilizes.
Technical Analysis and Outlook for Key Tokens
The market’s technical picture on October 27, 2025, combines price structure, on-chain fundamentals, and macroeconomic context. Sentiment is neutral at 42 on the Fear and Greed Index, showing cautious optimism. The Altcoin Season Index at 29 signals a Bitcoin-led environment. If stability returns, rotation toward altcoins could follow.
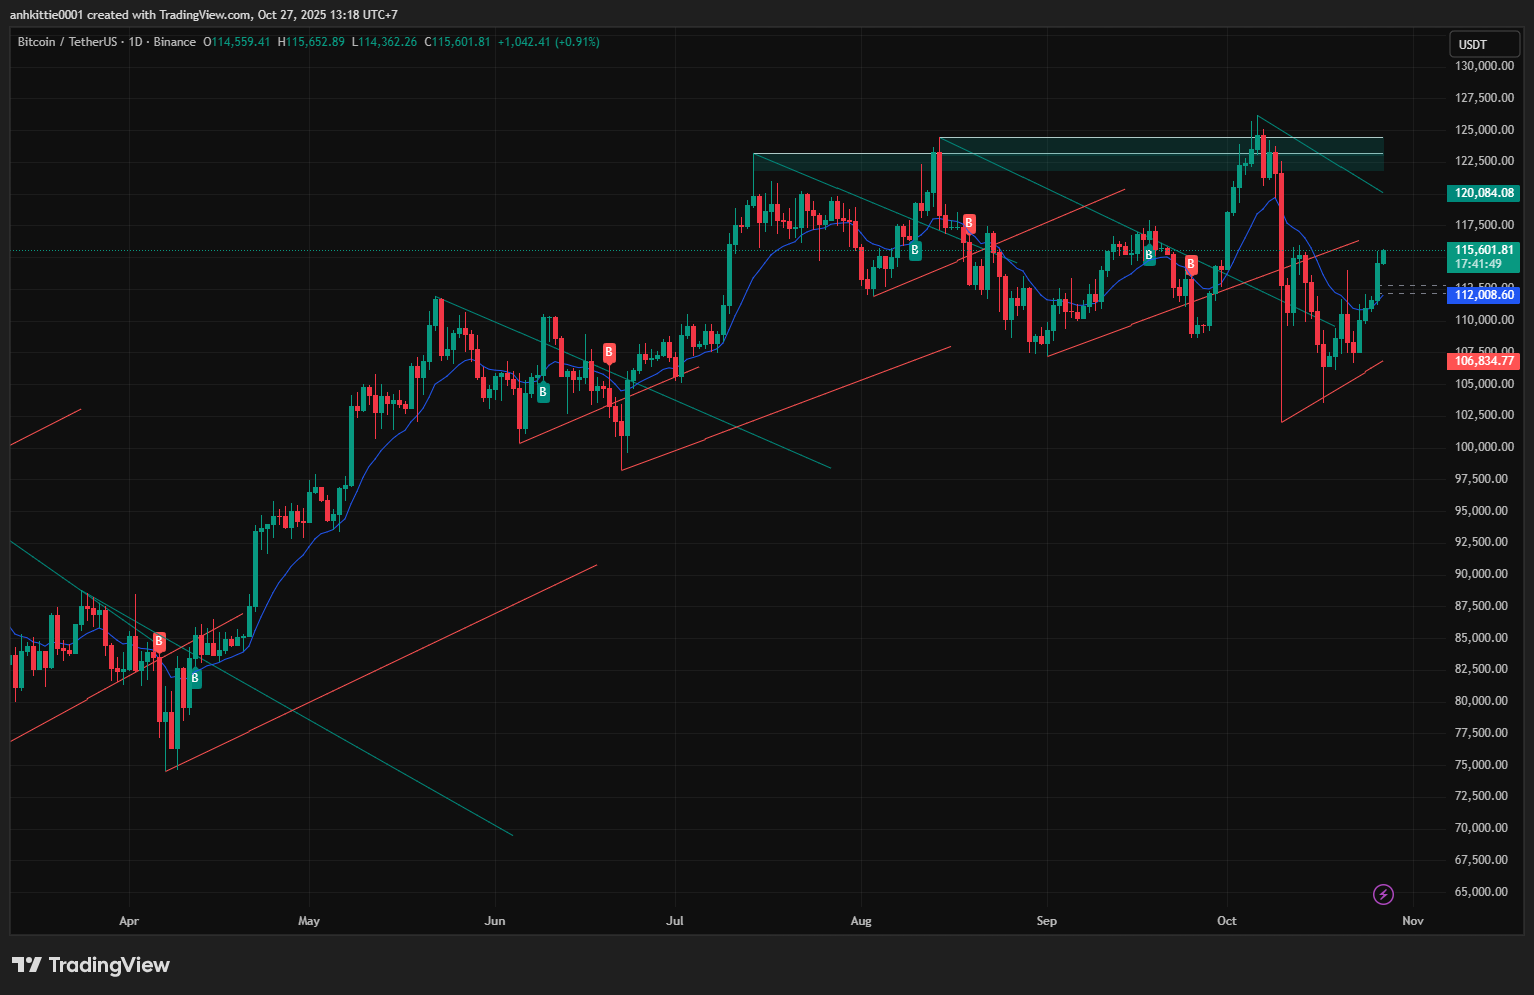
The BTC/USDT daily chart on Binance (Image 4) shows a price of $110,864.77, down 0.91%. The broader structure remains bullish, supported by an ascending channel that started in February 2025. The $106,000 level has acted as strong support after the tariff-related drop, and higher lows from $96,000 confirm market strength.
Bitcoin is consolidating below the 50-day moving average near $112,000, forming a descending wedge pattern. The chart highlights buy zones near $108,000 and short-term selling areas near recent peaks. Volume has tapered during the rebound, the RSI reads 48 with a neutral divergence, and Bollinger Bands have tightened, suggesting an upcoming breakout. The MACD has flattened, signaling equilibrium.
Fundamentals: ETF inflows reached $3.24 billion. Metaplanet added $632 million in BTC, and institutional demand remains about four times mining output. Long-term holders control 73% of supply, while whale holdings total around 147,000 BTC.
Macroeconomic factors: Tariffs lowered sentiment by 14%, but a possible Fed rate cut keeps the dollar index near 98.2 and encourages BTC as a hedge asset. Gold trades at $4,080, showing similar investor behavior.
Scenarios:
- A break above $112,000 could target $118,000–$122,000. Historically, post-crash recoveries with NUPL near 0.5 have produced 40% gains.
- A drop below $106,000 could test $100,000 and trigger $39B in open interest liquidation.
- Sideways consolidation between $106,000 and $112,000 is likely during tariff uncertainty.
Bias: Moderately bullish with MVRV at 2.6, signaling fair valuation.
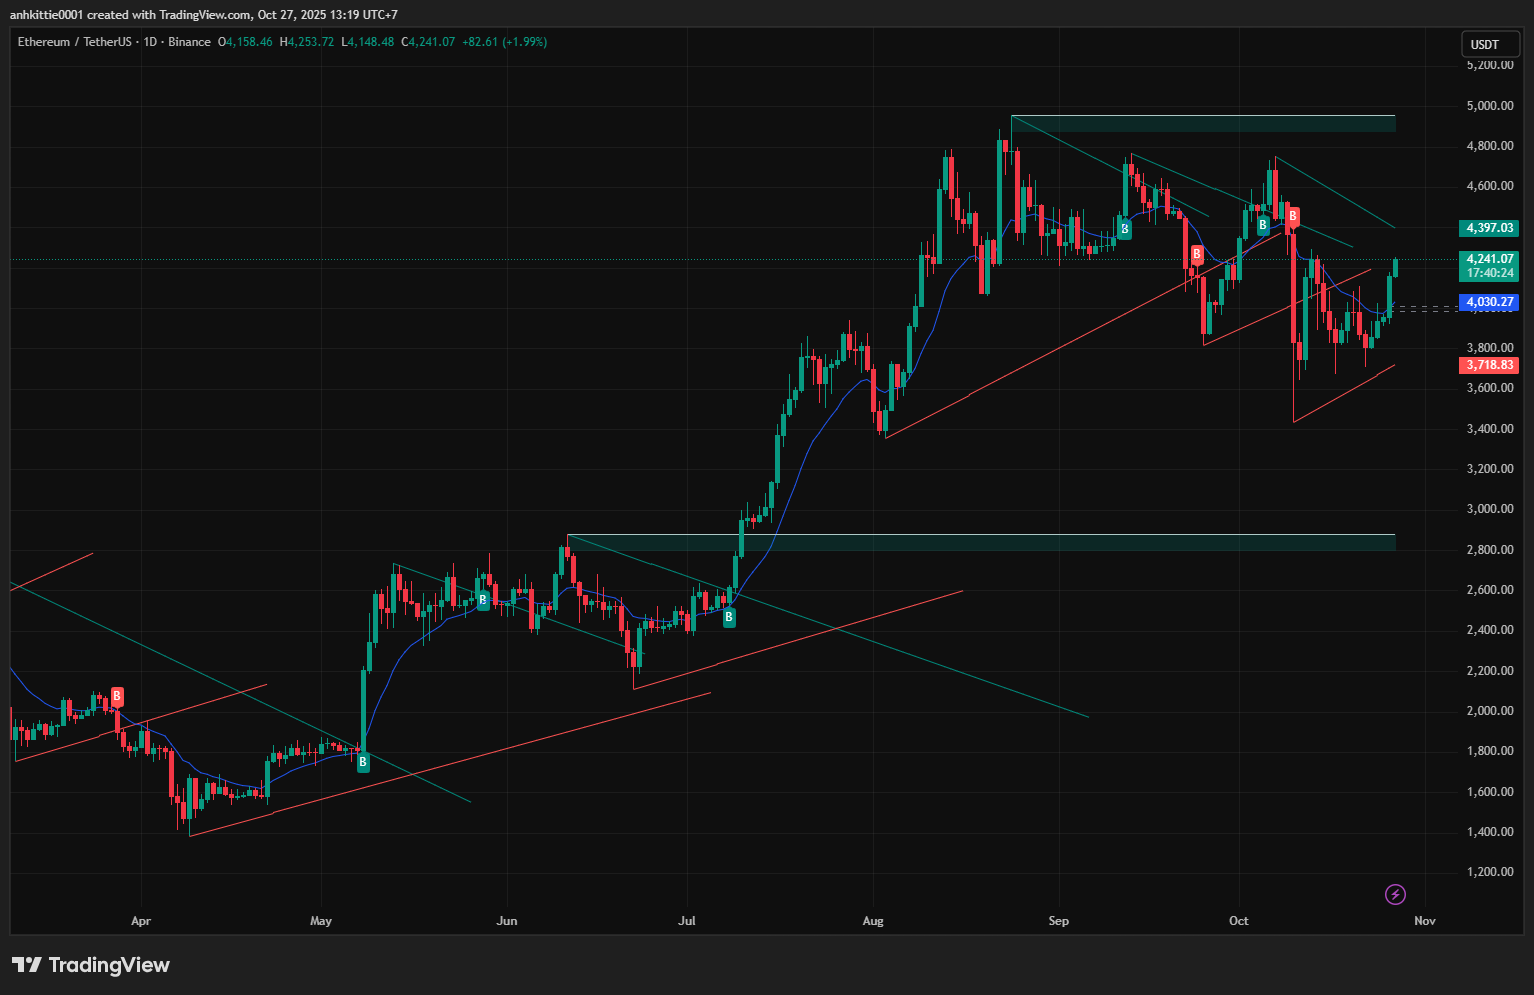
The ETH/USDT daily chart on Binance (Image 5) shows Ethereum at $4,158.46, up 1.45%. The price continues to move inside an ascending channel, forming a triangle pattern. Support at $3,600 held during volatility, and the 50-day moving average near $4,100 is now acting as short-term support.
Technically, a falling wedge formation points to potential upside. Buy zones cluster near $4,000, while resistance lies around recent highs. Volume increased on rebounds, and the RSI at 46 suggests mild oversold conditions. MACD momentum is fading, and Bollinger Bands are contracting, signaling a buildup before expansion.
Fundamentals: ETF inflows reached $1.3 billion. Staked ETH totaled 29.5 million. The Fusaka testnet achieved strong results ahead of its December mainnet phase. DeFi TVL stabilized near $43B, and gas prices stayed consistent.
Macroeconomic factors: Tariffs cut risk appetite by up to 30%, but expected Fed easing and China’s stimulus offer some offset.
Scenarios:
- A close above $4,200 could open targets at $4,400–$4,600 and push ETH/BTC toward 0.036–0.08.
- A drop below $4,100 may bring retests of $3,800.
- Sideways action between $4,100 and $4,200 could persist if tariffs remain unresolved.
Bias: Bullish, supported by strong utility and steady inflows.
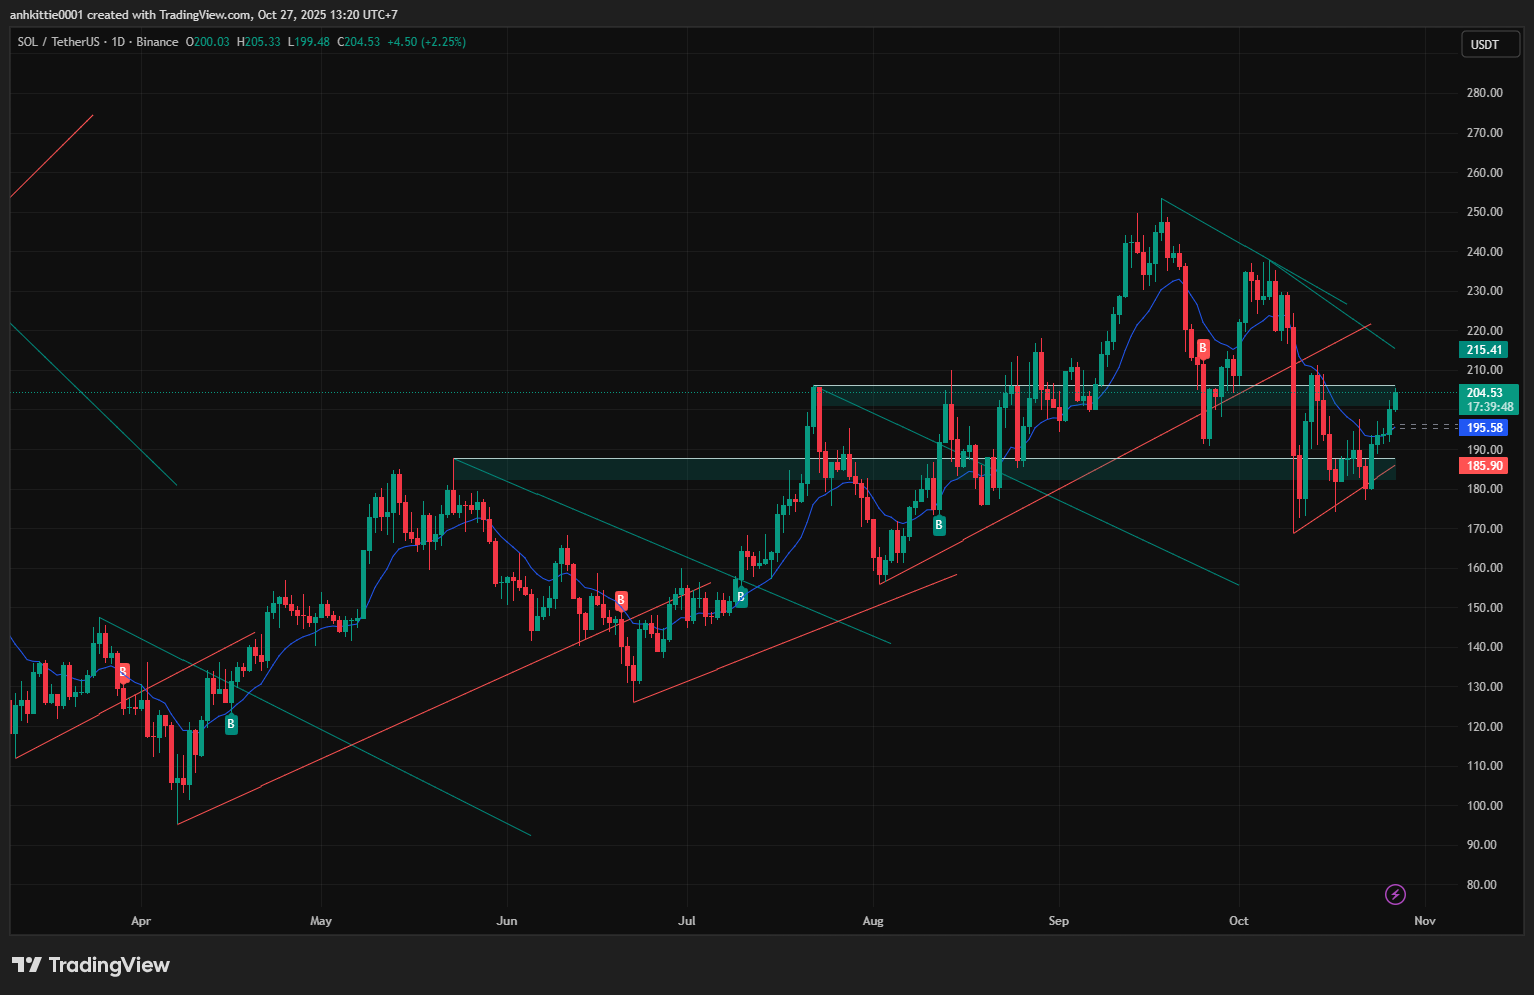
The SOL/USDT chart on Binance (Image 6) shows Solana at $187.88, up 2.25%. The price follows a rising channel that has held since March 2025. Support at $180 was tested and confirmed, maintaining higher highs and higher lows. A bull flag pattern suggests room for continuation.
RSI stands at 52, indicating balance. MACD shows positive momentum, and widening Bollinger Bands confirm higher volatility. Trading volume supports the recovery trend.
Fundamentals: The Alpenglow update reduced fees by 40%. TVL reached $13.5B, slightly lower but stabilizing. The user base surpassed 1 million. Kazakhstan’s Evo stablecoin partnership added new use cases.
Macroeconomic factors: Tariff impact on Solana remains limited. A potential Fed rate cut could lift DeFi sentiment further.
Scenarios:
- A breakout above $190 could target $200–$210, echoing the strong performance of 2021.
- A decline below $180 might retest $170.
- Range trading between $180 and $190 remains likely if Bitcoin dominance continues.
Bias: Bullish, driven by ecosystem growth and stable user metrics.
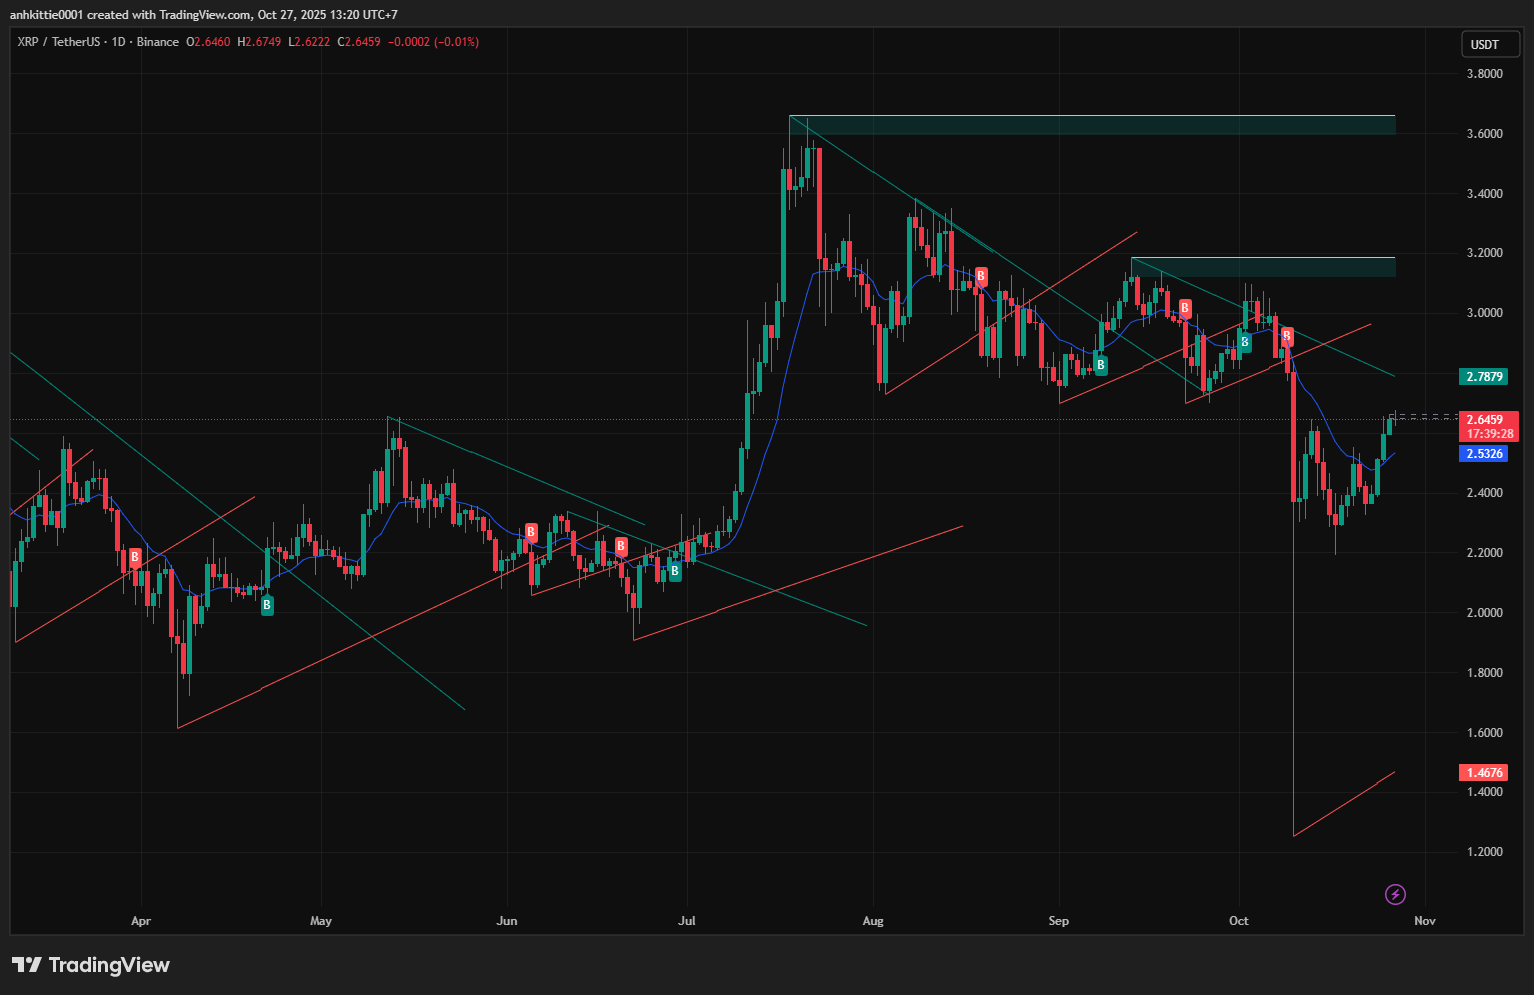
The XRP/USDT daily chart on Binance (Image 7) shows XRP at $2.4403, down 2.07%. The token trades inside a descending triangle pattern between $2.30 and $2.70. The red trendline caps resistance, while $2.30 acts as key support.
RSI at 45 signals mild oversold conditions. Volume remains low but could precede a breakout. Bollinger Bands are narrowing, often a sign of coming expansion.
Fundamentals: SWIFT pilots processed over $5 trillion using XRP’s technology. On-Demand Liquidity (ODL) volumes stayed steady at $1.3B.
Macroeconomic factors: Trade tariffs may affect cross-border settlement flows, though easing monetary policy supports payment adoption.
Scenarios:
- A breakout above $2.70 could lift XRP to $2.90–$3.10, aligned with ETF interest.
- A breakdown below $2.30 might lead to $2.10.
- Sideways movement could persist while volume remains thin.
Bias: Neutral with low volatility, awaiting new catalysts.
Institutional Inflows: Stabilizing Force in Turbulence
Institutions continued to play a central role in cushioning market declines. During the week, net inflows reached $720 million, marking the fourth consecutive week of positive institutional activity. This strength came despite $20 billion in liquidations during the tariff-driven selloff.
BlackRock’s IBIT led with $420 million in Bitcoin inflows, followed by ETHA’s $300 million, which pushed annualized ETF revenue to about $260 million. Fidelity and Grayscale also contributed strong inflows. Bitwise reported that institutional purchases outpaced mining supply by 3.5 times, highlighting growing demand.
Corporate activity reinforced this trend. Metaplanet expanded its Bitcoin holdings by $632 million, showing renewed confidence from public companies. On-chain data showed ETF holdings rising to 520,000 BTC, up 5% even after the market crash.
Vanguard’s decision to resume crypto trading reflected shifting sentiment among large asset managers. According to Coinbase’s Brian Armstrong, this could unlock trillions in new institutional capital once regulatory clarity improves.
Reports from Crypto.news emphasized how institutional flows reduced downside pressure and forecast stronger demand once tariff tensions ease. Venture capital activity also strengthened, with Zerohash raising $104 million and OranjeBTC entering the Brazilian market. These moves signaled growing confidence in long-term crypto adoption.
Macroeconomic Backdrop: Tariffs Dominate, Fed Easing Counters
Macroeconomic Backdrop and Policy Developments
The global macro environment remained a defining influence on digital asset performance. The United States and China continued their tariff dispute, which briefly erased $2.3 trillion from global market capitalization before a partial recovery.
In the United States, the Federal Reserve hinted at a 25-basis-point rate cut during the upcoming meeting. The dollar index fell to 98.2, reflecting weaker demand for the greenback. Gold traded near $4,080, showing strong safe-haven interest alongside Bitcoin.
China announced additional liquidity injections and tax incentives to stabilize exports, which supported risk sentiment in Asian markets. Japan maintained its yield-curve control policy, while the European Central Bank paused tightening. These coordinated policy signals helped calm investors and restore partial confidence after the tariff shock.
The Bank of International Settlements reported growing interest in central bank digital currencies. More than 70% of global monetary authorities are now in advanced testing or pilot stages. These initiatives reflect the accelerating shift toward blockchain-based financial infrastructure.
From a capital flow perspective, the crypto market remains increasingly tied to traditional liquidity cycles. Analysts noted a 0.86 correlation between Bitcoin and Nasdaq performance during the week. Institutional investors now view Bitcoin less as a speculative play and more as a macro hedge against fiat volatility and debt expansion.
Policy Wins: Advances Amid Scrutiny
Grayscale multi-crypto ETFs approved, Bored Ape non-securities. Tether USAT, Shiba stablecoin. Kazakhstan Evo Solana/Mastercard, Naver Upbit Korea hub. SWIFT XRP $5T, Google L1 600K. UK-U.S. taskforce, EU digital-euro. WLFI USD1 Aptos, Token2049 25K, MoonPay AI. Legitimize amid probes.
Ethereum’s Resurgence and Flippening Debate
ETH $4,040 hold $4,100, Fusaka December. ETF $300M, staking 29.5M. Lee $7,500 Q4. ETH/BTC 0.036-0.09 ($10K). Lubin flippening; Chainlink $1.3M; TRON $620B. PSE 2026.
Bitcoin’s 4-Year Cycle: Crash Test
Hougan ETF damping, polls 62% intact. Chart: surge, tariff dip, Q4 $130K-140K. Hyperliquid 45% HYPE.
Other News: Funding, Hacks, Launches
Gemini $5B IPO; Polymarket $10B; Shibarium patch $2.4M; Solana Alpenglow 40%; Jupiter $130M; Ordinals forks; Base 1.3M. Aster $680M Oct 14; Solstice SLX; USDD 8%; MetaMask $30M LINEA; Sonic breakout; ZEC/DASH/XMR rally; Hypurr $68.9K; Plasma $15B $2B; China CNH; Tether USAT; pre sales Blockchain FX/Pepeto/BullZilla. Zerohash $104M, OranjeBTC Brazil. UXLINK $11.3M, pre-announcement probes. Kresus wallets, Mini Apps; BNB 56.4M MAU flip; Monad checker; stablecoins $6T >Visa; outflows records. Events illustrate evolution.
Conclusion: From Chaos to Opportunity in Crypto’s Resilient Landscape
This week showed crypto’s sensitivity to macro shocks as Trump’s tariff erased $1 trillion in value and caused $20 billion in liquidations within a day. Bitcoin dropped 14%, while Ethereum and altcoins fell up to 30%. Despite the selloff, $720 million in institutional inflows, $260 million in ETF revenue, and Metaplanet’s $632 million BTC purchase helped stabilize sentiment.
Rate cut hopes and softer CPI eased fears of stagflation, while Grayscale ETF wins, Vanguard’s crypto pivot, and new launches like Tether USAT and Shiba stablecoin signaled growing maturity. Ecosystem progress included Solana’s Alpenglow, Ethereum’s Fusaka, and rising adoption through Kazakhstan’s Evo, SWIFT’s XRP tests, and EU digital euro pilots.
VC activity stayed strong with Gemini’s IPO plans, Zerohash’s $104 million round, and Polymarket’s $10 billion valuation. Analysts see BTC holding above $112K to target $118K–$130K, while altcoins could gain 20–50% if tariffs ease. Resilience amid volatility continues to define crypto’s path into the year-end.