
Ethereum Price Poised for $6K Rally Following Gold Fractal Pattern
Technical Analysis Shows Strong Bullish Signals for ETH
Ethereum’s price structure is mirroring a powerful gold fractal pattern that historically preceded significant rallies, with analysts targeting $5,000-$6,000 price levels in the coming months.
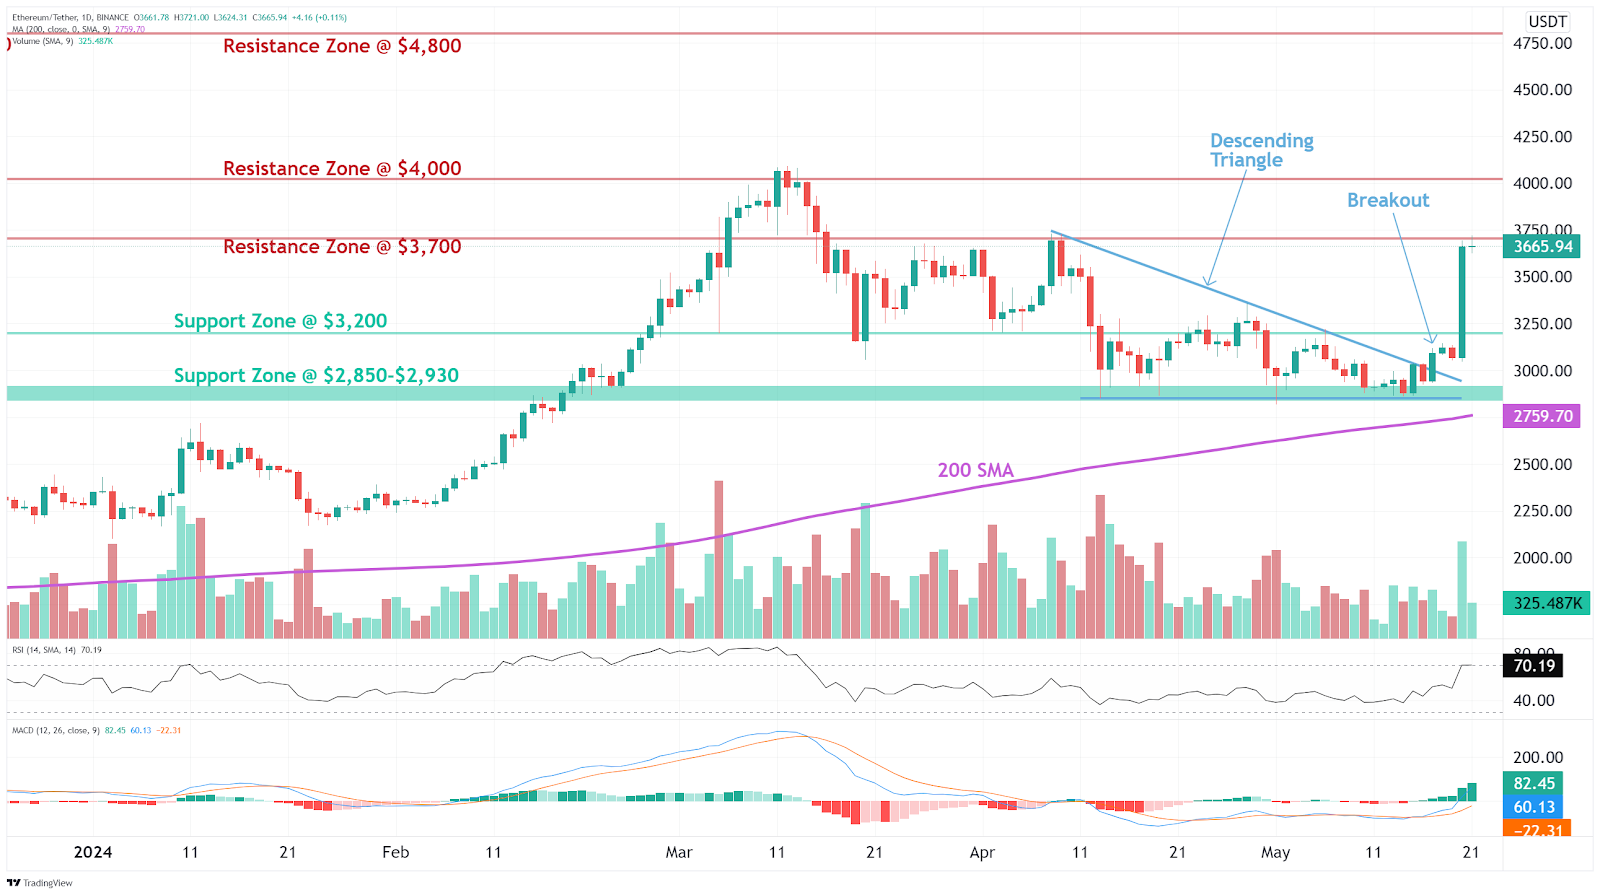
Ethereum technical analysis reveals bullish patterns Source: altFINS
Gold Fractal Pattern Signals Major Breakout
A compelling side-by-side analysis reveals Ethereum following gold’s multi-year accumulation structure from 2019-2024. Both assets display an identical five-point formation featuring two local peaks, two deep corrections, and a rounded base formation before explosive upward movement.
Gold completed this pattern with a breakout above $2,100 in early 2024, subsequently rallying over 60% to reach new all-time highs above $3,400. Ethereum currently sits at the same critical juncture, bouncing from its $1,600 low and approaching the crucial $3,000-$3,500 resistance zone.
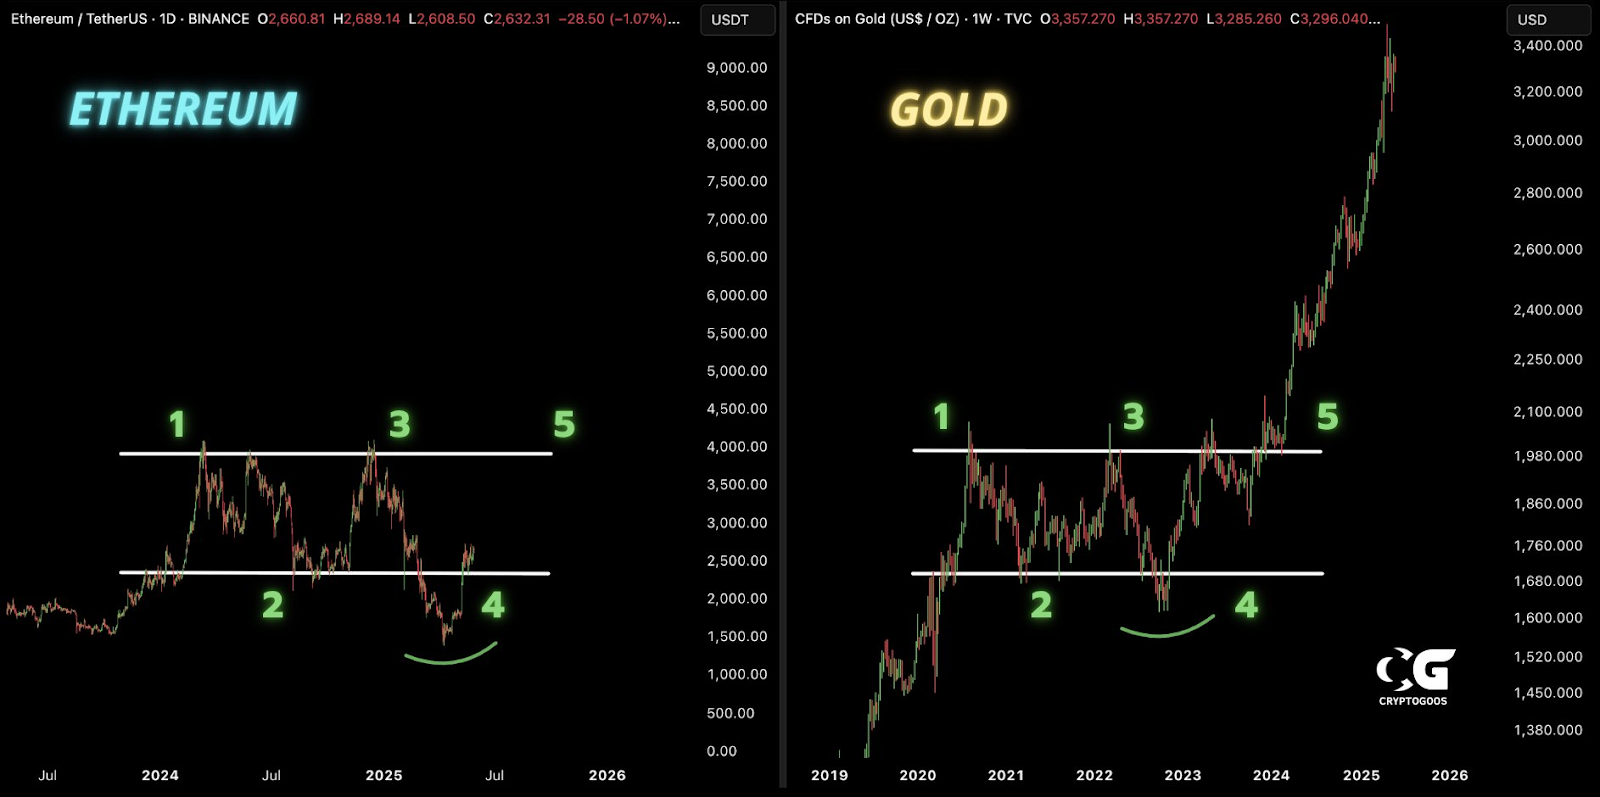
Gold fractal pattern supports ETH target Source: FXStreet
Historical Fractal Repeating for Massive Gains
Technical analyst Crypto Eagles identifies another bullish pattern from Ethereum’s 2016-2017 cycle that’s repeating in the current market environment. This four-stage pattern includes extended consolidation, sharp shakeout moves, resistance breakouts, and parabolic price acceleration.
The 2017 structure delivered over 1,000% gains, propelling ETH from sub-$10 levels to above $1,400. Current market positioning shows Ethereum following a similar trajectory with its $1,600-$4,000 range and subsequent pullback, now rebounding toward the critical $3,500-$4,000 breakout zone.
“The fundamentals are 10x stronger. $5k – $6k EASY THIS CYCLE,” notes the analyst, highlighting the enhanced market conditions compared to previous cycles.
Institutional Demand and Market Dynamics Support Rally
Several fundamental factors strengthen Ethereum’s bullish outlook. Ether-focused investment funds attracted $321.4 million in institutional inflows during the week ending May 30, representing the largest influx among all cryptocurrency assets according to CoinShares data.
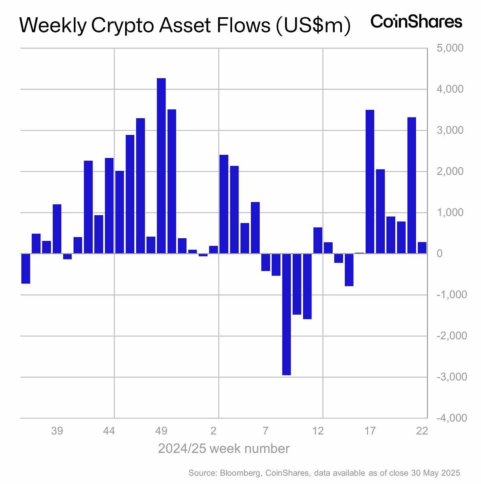
Weekly institutional crypto investment flows data Source: The Crypto Times
Additionally, Ethereum is benefiting from cooling memecoin speculation that previously drove capital toward Solana. As SOL/ETH charts develop bearish patterns, analysts from Standard Chartered expect ETH to extend its market dominance.
Price Target and Timeline
Technical analysis suggests Ethereum could reach $5,000-$6,000 range if current fractal patterns continue developing. The convergence of technical breakout signals, institutional adoption, and improving market positioning creates a compelling case for significant upward price movement in the coming months.
Current ETH price: $2,617