Mastering Candlestick Charts: A Beginner’s Comprehensive Guide
Candlestick charts provide a quick visual snapshot of market price movements, showing whether they were positive or negative and to what degree. Originating in Japan in the 18th century for rice trading, these charts were later introduced to the West by Steve Nison in his book, Japanese Candlestick Charting Techniques. Today, candlestick charts are among the most widely used tools in financial trading and are available on all major trading platforms.

Bitcoin – USD candlestick chart. Source: TradingView
Candlestick charts are designed for various timeframes, ranging from one-second intervals for very short-term traders to weekly and monthly charts for long-term investors.
Anatomy of a Candlestick
Similar to bar charts, candlesticks visualize the open, high, low, and close (OHLC) prices, but they offer better clarity.
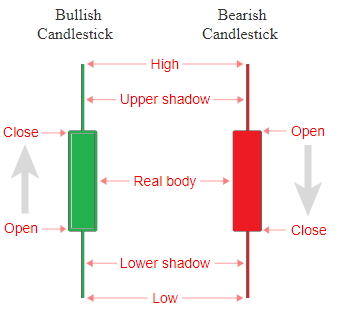
Open, High, Low, and Close. Source: datavizcatalogue.com
Key Components:
By analyzing candlestick patterns, traders can identify trends and predict potential market movements.
Understanding One-Candle Signals

4 types of one-candle signals. Source: Coinbase
Sometimes, a single candlestick can provide critical insights. Below are four essential one-candle signals:
While one-candle signals are useful, always analyze them within the broader market context.
How to Read Candlestick Charts
Key Elements of a Chart

The highs and lows. Source: Alec40 on TradingView
Identifying Trends
A simple way to spot a trend is to observe the movement of prices from the lower left to the upper right of the chart (uptrend) or vice versa (downtrend). Breaking previous highs or lows provides additional confirmation of the trend.
Common Candlestick Chart Patterns
1. Shooting Star:
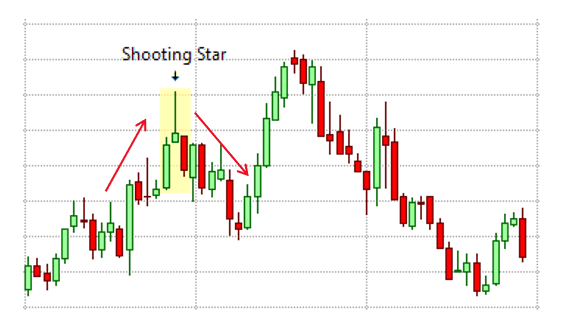
Shooting star
2. Hammer
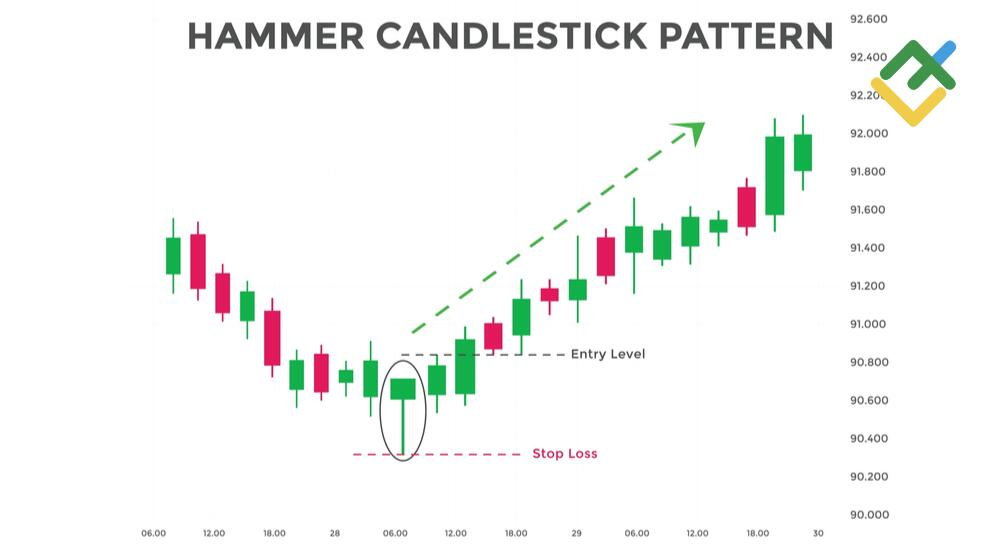
Hammer. Source: litefinance
3. Inverted Hammer

Inverted Hammer. Source: Forex School Online
4 Head and Shoulders:

Head and shoulders. Source: Coinjar
5. Wedges
Conclusion
Mastering candlestick charts is crucial for analyzing market trends and making informed trading decisions. By understanding their structure, signals, and patterns, you can confidently navigate volatile markets and optimize your trading strategies.