Price Action Reversal Strategy: Mastering Trend Changes in Trading

In the fast-paced world of financial markets, recognizing when a trend might shift offers traders a distinct advantage. Building on foundational Price Action concepts, this guide delves into Price Action Reversal Strategies – techniques designed to help traders spot potential turning points in market trends. Applicable across diverse markets like forex, stocks, commodities, or cryptocurrencies, these strategies provide a straightforward, indicator-free method for spotting reversals. We'll cover the essence of reversal strategies, their advantages, inherent risks, common patterns, effective trading techniques, and practical examples, aiming to be a thorough resource for traders of all experience levels.
What is Price Action Reversal Strategy? /A Price Action Reversal Strategy centers on analyzing raw price movements directly on a chart. The goal is to identify moments when an existing trend—whether upward (bullish) or downward (bearish)—shows signs of reversing. In contrast to continuation patterns, which signal a trend's persistence, reversal patterns suggest a shift in the underlying balance between buyers and sellers. This shift can potentially herald a new trend in the opposite direction. Relying purely on price data, these strategies bypass lagging indicators, offering a direct reflection of collective market psychology.For instance, a Head and Shoulders pattern, featuring three peaks with the central one (the head) being the highest, typically signals a bearish reversal once the price breaches the neckline that connects the lows of the two shoulders. Likewise, a Double Top pattern forms when the price reaches a similar high point twice without breaking through, indicating waning buyer strength and potentially setting the stage for a downtrend. The universality of these patterns across various markets, including forex, stocks, and cryptocurrencies, makes these reversal strategies highly versatile tools for traders.
Benefits of Price Action Reversal StrategiesPrice Action Reversal Strategies come with several compelling advantages:
- Early Trend Identification: Spotting reversal patterns enables traders to potentially enter new trends near their inception, which can maximize profit opportunities. Catching a Double Bottom early, for instance, might position a trader advantageously for an emerging uptrend.
- Insights into Market Psychology: Formations like Engulfing Candles can vividly illustrate shifts in trader sentiment—for example, buyers decisively overpowering sellers—thereby offering a clearer understanding of market dynamics.
- Cross-Market Versatility: Because they focus on universal price behaviors, these strategies are applicable in diverse markets, including forex, stocks, commodities, and cryptocurrencies.
- Streamlined Decision-Making: Working with clean charts, free of indicators, allows traders to make quicker decisions based directly on real-time price movements, a feature particularly beneficial for short-term trading styles.
Despite their potential, reversal strategies are not without challenges:
- False Signals: Apparent reversal patterns can sometimes turn out to be mere pullbacks within an ongoing trend. Acting on these prematurely can lead to losses.
- Swift Reversals: Particularly in volatile markets such as forex, reversals can happen rapidly, demanding quick responses to capitalize on opportunities or mitigate losses.
- Interpretive Subjectivity: Pattern recognition isn't always black and white; interpretations can differ among traders based on their experience and perspective, potentially leading to varied outcomes.
To mitigate these challenges, traders are advised to always seek confirmation through subsequent price action—such as a clear breakout or a decisive candlestick close—and consistently apply robust risk management techniques, including stop-loss orders.
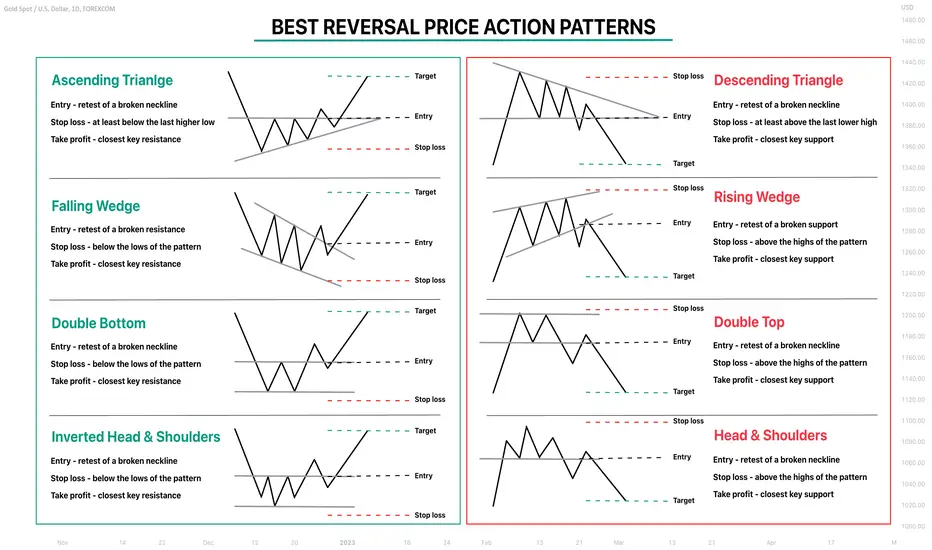
Key Reversal PatternsBelow are the most important reversal patterns traders should master, each with a description, significance, and trading approach:
Source: TradingView
| Pattern | Description | Significance | How to Trade |
| Ascending Triangle | Higher lows pressing against horizontal resistance. | Signals bullish reversal when price breaks above horizontal resistance. | Entry: Consider entry on a retest of the broken horizontal resistance. SL: Below last significant higher low.TP: Closest key resistance. |
| Falling Wedge | Price contracts downward with converging trend lines. | Signals bullish reversal when price breaks above upper trendline. | Entry: Look for an entry when price retests the broken upper trendline.SL: Below pattern's lowest point.TP: Closest key resistance. |
| Double Bottom | Two lows at similar levels after a downtrend. | Signals bullish reversal when price breaks above the neckline resistance. | Entry: An entry can be made upon a retest of the breached neckline.SL: Below pattern lows.TP: Closest key resistance. |
| Inverted Head & Shoulders | Three troughs, with the middle one being the deepest. | Signals bullish reversal when price breaks above the neckline resistance. | Entry: Consider entering on a retest of the broken neckline.SL: Below pattern's lowest point (the head). TP: Closest key resistance. |
| Descending Triangle | Lower highs pressing against horizontal support. | Signals bearish reversal when price breaks below horizontal support. | Entry: Look for an entry on a retest of the broken horizontal support. SL: Above last significant lower high. TP: Closest key support. |
| Rising Wedge | Price contracts upward with converging trend lines. | Signals bearish reversal when price breaks below lower trendline support. | Entry: An entry might be taken when price retests the broken lower trendline. SL: Above pattern's highest point. TP: Closest key support. |
| Double Top | Two highs at similar levels after an uptrend. | Signals bearish reversal when price breaks below the neckline support. | Entry: Consider entry upon a retest of the breached neckline. SL: Above pattern highs. TP: Closest key support. |
| Head & Shoulders | Three peaks, with the middle one being the highest. | Signals bearish reversal when price breaks below the neckline support. | Entry: Look to enter on a retest of the broken neckline. SL: Above pattern's highest point (the head). TP: Closest key support. |
Detailed Pattern Insights
/Bottoms: These formations illustrate repeated unsuccessful attempts to breach key price levels, often indicating trend exhaustion. Their significance is amplified when they form at major, pre-existing support or resistance zones.
To effectively spot reversal patterns, consider these steps: {"ordered":true}
- Assess the Prevailing Trend: First, confirm the current market trend—be it an uptrend (characterized by higher highs and higher lows) or a downtrend (lower highs and lower lows)—using tools like trendlines or simple moving averages. Reversal patterns generally carry more weight when they form against an established trend.
- Pinpoint Key Levels: Identify significant support and resistance areas. These can be found through recent swing highs and lows or by using tools like Fibonacci retracement, as reversals frequently initiate from these zones.
- Watch for Candlestick Signals: Keep an eye out for specific candlestick patterns such as Dojis, Engulfing patterns, or Pin Bars, especially when they form at your identified key levels. These can be early indicators of a potential reversal.
- Consider Volume (Optional): Although pure Price Action trading typically eschews indicators, a surge in volume during a pattern's breakout can serve as a useful confirmation of its validity.
- Corroborate Across Multiple Timeframes: A reversal pattern observed on, say, a 4-hour chart gains credibility if it aligns with similar indications on a higher timeframe, like a daily chart. This multi-timeframe analysis provides a broader market context.
Executing trades based on reversal patterns requires precision:
- Strategic Entry Points: Prudent entry typically occurs after confirmation. This might be a clear break of a neckline in a Head and Shoulders pattern, or the definitive close of an Engulfing candle.
- Careful Stop-Loss Placement: Position stop-loss orders strategically beyond the extremity of the pattern (for instance, above the second peak in a Double Top formation) to safeguard against false signals and manage risk.
- Setting Take-Profit Targets: Determine take-profit levels by using the pattern’s height as a measured move or by identifying previous significant swing levels. For example, with a Head and Shoulders pattern, one common method is to measure the distance from the head to the neckline and project that distance downwards from the breakout point.
- Maintain a Favorable Risk-Reward Ratio: Consistently aim for a risk-reward ratio of at least 1:2 (risking, for example, 50 pips to potentially gain 100 pips). This discipline is crucial for achieving long-term profitability.
To maximize your success, try to steer clear of these common pitfalls:
- Entering Too Early: Acting before confirmation (e.g., before a neckline break) significantly increases the risk of false signals.
- Ignoring the Dominant Trend: Reversals against a very strong, established trend are often less reliable. Always consider the broader market context.
- Neglecting Risk Management: Trading without stop-losses or risking an excessive portion of your capital per trade can lead to substantial losses. A common guideline is to risk no more than 1-2% of your trading capital on any single trade.
While Price Action Reversal Strategies demonstrate effectiveness across diverse markets, traders should be mindful of certain market-specific nuances:
- Forex Market: High-impact economic news releases and central bank policy announcements can often act as catalysts for rapid reversals. Staying informed with an economic calendar is advisable.
- Stock Market: In equities, corporate earnings announcements, industry-wide news, or major sector developments can trigger reversals. Therefore, an awareness of company-specific fundamentals can be beneficial.
- Cryptocurrency Markets: The crypto space is known for its high volatility. Sentiment-driven price swings, often influenced by regulatory news or social media trends, can cause sharp and sudden reversals, underscoring the need for especially stringent risk management.
To further refine the accuracy of reversal strategies, traders can incorporate these supplementary techniques:
- Fibonacci Retracement Levels: Employ Fibonacci retracement levels to pinpoint potential reversal zones. Their effectiveness can be enhanced when these levels coincide with confirmatory candlestick patterns.
- Oscillator Divergence: Although it involves an indicator, observing divergence between price action and an oscillator (like the RSI or MACD) can provide strong confirmation for potential reversals.
- Trend Channels: Constructing trend channels can help identify potential reversals when the price decisively breaks out of a well-defined channel boundary.
Price Action Reversal Strategies are techniques that analyze raw price movements to spot trend changes—using patterns like Head and Shoulders, Double Tops
Bottoms, and Pin Bars—without relying on lagging indicators.
2. Which markets can I apply these strategies to?
You can apply price action reversal techniques in forex, stocks, commodities, and cryptocurrencies—while adjusting for each market’s volatility, news drivers, and liquidity.
3. What are the key reversal patterns I should learn?
Key reversal patterns include Head and Shoulders (bearish), Double Top
Bottom (trend exhaustion), Ascending
Descending Triangles (breakout-driven), Rising
Falling Wedges (converging trendlines), and Pin Bars (price rejection).
4. How can I confirm a reversal pattern to avoid false signals?
Confirm by waiting for a decisive breakout or candlestick close (e.g. neckline break, Engulfing candle) and look for increased volume, alignment on higher timeframes, or Fibonacci levels matching the pattern.
5. What are the risks of trading reversal patterns?
Reversal trading risks include false signals (pullbacks misread as reversals), rapid price swings in volatile markets, and subjective interpretation—so always use confirmation methods and strict risk management.
6. How should I set stop-loss and take-profit levels?
Place your stop-loss just beyond the pattern extreme (e.g. above the head in Head and Shoulders), and set take-profit using the pattern’s height projection or the next major support/resistance, aiming for at least a 1:2 risk-reward ratio.
7. What mistakes should I avoid when trading reversals?
Avoid jumping in before confirmation, trading against strong underlying trends, and over-risking capital—limit each trade to 1–2% of your account and always use a stop-loss.
8. Can I enhance reversal strategies with other tools?
Yes—overlay Fibonacci retracements to identify reversal zones, use oscillator divergence (RSI, MACD) for extra confirmation, and draw trend channels to catch breakouts.
9. Why is multi-timeframe analysis important?
Multi-timeframe analysis ensures patterns on higher timeframes (e.g. daily, 4-hour) confirm those on lower ones, providing broader context and making reversal signals more reliable.
10. How can I practice these strategies effectively?
Use a demo account to hone your pattern recognition and execution, back-test historical charts to review outcomes, and track market-specific events (e.g. economic news, earnings) to refine your approach.