Weekly Crypto Recap Sep 15–22, 2025 – Market Pullback
Let’s take a closer look at Weekly Crypto Recap from September 15–22, 2025, a week shaped by pullbacks and cooling altcoin momentum. Market cap eased 1.7% to $3.97 trillion, yet trading volumes stayed firm, showing investors remained active. Bitcoin held critical support near $114K while Ethereum and altcoins felt sharper selling pressure. Still, $720 million in ETF inflows highlighted institutional confidence, keeping the longer-term outlook resilient despite macro headwinds.
A Week of Consolidation and Corrective Pressures
The cryptocurrency market during the week of September 15-22, 2025, entered a phase of consolidation and correction following the exuberant surge of the previous period, where total capitalization had briefly eclipsed $4 trillion. By week’s end, the overall market cap settled at $3.97 trillion, representing a 1.7% decline from the prior close of $4.04 trillion, as broader risk-off sentiment in global financial markets spilled over into digital assets. This pullback was characterized by heightened volatility, with daily trading volume averaging $133.02 billion—a slight uptick from the previous week’s $129.18 billion—indicating active participation despite the downward pressure. Bitcoin (BTC), the sector’s anchor, traded at $114,511.21, down 0.99% on the final day but reflecting a 0.7% weekly loss after failing to sustain above $116,000. Ethereum (ETH) fared worse, closing at $4,297.33 with a 3.91% daily drop and a 7.2% weekly decline, as profit-taking intensified following its recent all-time high run.
Altcoins experienced mixed fortunes but generally underperformed, with Solana (SOL) at $223.34 (-3.69% daily, -8.3% weekly) retreating from its breakout levels amid ecosystem-specific concerns like network congestion reports. XRP stood at $2.8994 (-3.24% daily, -4.8% weekly), holding relatively steady on regulatory optimism, while BNB at $1,028.45 (-3.42% daily, -9.1% weekly) cooled after a streak of consecutive all-time highs in recent weeks, as profit-taking set in despite resilient demand within the BNB Chain ecosystem. The CMC Crypto Fear and Greed Index dipped to 47 (Neutral), down from 51, capturing a sentiment shift toward caution as liquidation events totaled $280 million mid-week. Key themes this period included a cooling of the altcoin season rally, with the index retreating to 67/100 after peaking at 73; ongoing institutional inflows providing a floor, albeit at reduced pace with $720 million net into ETFs; and macroeconomic headwinds from hotter-than-expected U.S. inflation data (CPI at 2.6% YoY vs. 2.5% forecast), tempering rate-cut enthusiasm to 75%.
This week’s dynamics contrasted with the prior period’s alt-driven euphoria, where rotations had propelled the market cap upward. Instead, it resembled classic mid-cycle corrections seen in 2021’s September, when similar macro surprises led to 10-15% drawdowns before October rebounds. On-chain metrics offered some solace: stablecoin inflows held steady at $2.1 billion, with USDC mints up 35% YoY, suggesting sidelined capital ready for deployment. Whale activity showed mixed signals—large holders distributed 12,000 BTC but accumulated ETH equivalents—while long-term holder (LTH) supply remained at 74% of circulating BTC, indicating conviction amid dips. Geopolitical factors, such as escalating U.S.-China tech tensions with new export controls on AI chips, indirectly supported crypto’s narrative as a decentralized hedge, though short-term correlations to Nasdaq (0.72) amplified sell-offs. Emerging market adoption continued apace, with India’s Chainalysis ranking slipping slightly but Pakistan’s licenses boosting regional volumes by 18%.
The market’s resilience was evident in the CoinMarketCap 20 Index at $252.05 (-1.95%), which held above key supports despite the cap contraction. As analysts from Darkex noted in their weekly insights, “September’s volatility is testing resolve, but fundamentals like ETF flows and policy tailwinds suggest this is a healthy shakeout before Q4 upside.” With $3.2 billion in token unlocks looming through October, risks of further pressure persist, but reduced leverage (OI down 8% to $37B) mitigates liquidation cascades. Overall, this week positions the market for a potential bottoming process, with “smart money” indicators like corporate treasuries adding BTC at dips signaling confidence in the long-term bull case.

From the CoinMarketCap overview (Image 1: Crypto Market Overview dashboard displaying total cap at $3.97T, volume $133.02B, Fear & Greed at 47, Altcoin Season Index at 67, and CoinMarketCap 20 Index at $252.05 -1.95%), the pullback is visually apparent: the cap line dips from mid-September highs, testing $3.9T support with volume spikes on down days, reflective of capitulation. Compared to last week’s $4.04T peak, this 1.7% retracement aligns with Fibonacci levels from the August low, often a buy zone in uptrends.
Analysis of Crypto Total Market Cap and Indices
The CoinMarketCap overview illustrates a week of corrective action, where the total cap’s decline from $4.04T erased half of the prior week’s gains. Volume at $133.02B, up modestly, suggests sellers met buyers at lower levels, preventing a cascade below $3.8T. The breakdown reveals BTC’s dominance steady at 57%, limiting alt bleeding, while the 30-day chart shows a double-top formation at $4.1T rejected, now consolidating above the 50-day MA at $3.85T. This setup mirrors 2023’s Q3 dip, where similar rejections led to 20% rebounds by Q4.
Historical context is key: September’s average -5.2% returns since 2013 make this week’s performance par for the course, but the volume profile—with bars thickening on rebounds—hints at accumulation. Ethereum’s influence waned, with its 17% share contracting on DeFi TVL dips to $42B amid risk aversion. Solana’s 2.8% share held firm on network upgrades, but XRP’s 1.2% slipped on delayed ETF news. Risks include overleveraged positions; benefits lie in flushed weak hands, setting up for October’s historical +30% BTC gains.

The CMC Crypto Fear and Greed Index at 47 (Neutral) (Image 2: Fear and Greed Index chart with current 47, historical: yesterday 48, last week 51, last month 46) reflects a moderation from last week’s optimism, entering a zone where fear (below 50) often marks opportunistic entries. The chart overlays BTC price (gray) and volume (blue), showing sentiment troughs aligning with mid-week dips, but rebounding as volume stabilized. Yesterday’s 48, last week’s 51, and last month’s 46 indicate volatility, with yearly highs at 88 (Nov 2024 Extreme Greed) and lows at 15 (Mar 2025 Extreme Fear) framing this as mid-cycle balance. Components like market momentum (down 15%) and volatility (VIX at 20) weigh, but social volume up 20% on X suggests underlying buzz. Past Septembers in Neutral ranges preceded 18-35% October rallies, per data from Alternative.me.

The CMC Altcoin Season Index at 67/100 (Image 3: Altcoin Season Index chart at 67, historical: yesterday 69, last week 72, last month 48) signals a cooling from peak alt dominance, down from 73 but still in “Altcoin Season” territory. The blue line (index) dips with alt cap (orange), yet up from last month’s 48, showing sustained rotation. Yesterday’s 69, last week’s 72, and last month’s 48 highlight a rapid but reversible climb, with the chart’s wicks tied to SOL’s pullback. At 67, alts outperform BTC by 12% over 90 days, less than last week’s 15%, but historical breaches of 65 often sustain for 4-6 weeks. Yearly high at 87 (Dec 2024) and low at 12 (Apr 2025 Bitcoin Season) position this as a pullback within an uptrend, potentially reigniting if BTC stabilizes.
Technical Analysis and Outlook for Key Tokens
The technical analysis of the cryptocurrency market as of September 22, 2025, reveals a landscape of corrective action following recent highs, with key tokens exhibiting signs of consolidation amid broader volatility. Market sentiment, as gauged by the Fear and Greed Index at 47, remains neutral, reflecting caution in the face of macroeconomic uncertainties such as Federal Reserve policy decisions and ongoing trade tensions. Bitcoin’s dominance holds steady at 57%, but the Altcoin Season Index’s retreat to 67 suggests a temporary pause in altcoin outperformance, allowing for potential re-accumulation if supports hold. This section examines the technical setups for BTC, ETH, SOL, and XRP, focusing on price action, indicators like RSI and moving averages, volume trends, and pattern formations. Probable scenarios—including uptrend resumptions, downtrend extensions, sideways ranges, or high-volatility breaks—are outlined, supported by historical analogies and on-chain data for a comprehensive view.

For Bitcoin (BTC/USDT on Binance, Image 4: Daily chart showing price at $115,232.22 down 0.62%, within an ascending channel from February 2025 lows), the structure maintains a bullish bias on higher timeframes, with the channel’s lower boundary at $110,000 acting as critical support, tested mid-week without a decisive break. Price has formed a series of higher lows since the July dip at $96,000, but the recent rejection at $118,000 has led to a pullback below the 50-day MA at $114,500, now serving as immediate resistance. A descending wedge is apparent from August highs, with red resistance lines converging on teal supports, annotated with buy (“B”) signals at bounces like the September 18 low at $112,000 and sell (“S”) at peaks around $116,000. Volume has contracted during the decline, typical of corrective waves, while RSI at 52 exhibits neutral divergence, with no oversold readings below 30. Bollinger Bands are tightening, often preceding volatility expansions, and the MACD histogram flattens, hinting at momentum stabilization.
Possible scenarios for BTC include an uptrend resumption if price reclaims $114,500, targeting the channel upper bound at $120,000-$122,000, potentially filling CME gaps and approaching all-time highs if ETF inflows accelerate. Historical post-halving corrections in 2021 saw similar 10-15% drawdowns leading to 60% rallies, corroborated by on-chain NUPL at 0.55, indicating unrealized profits supportive of bounces. Conversely, a downtrend extension below $110,000 could test the 200-day MA at $105,000 or even $100,000, amplified by leverage with open interest at $39B risking $150B in liquidations. Sideways consolidation appears likely short-term in the $110,000-$114,000 range, with moderate volatility of ±3-5% daily swings, favorable for mean-reversion strategies amid September’s seasonality. High volatility might spike on FOMC outcomes, driving ±8% moves. The overall bias leans mildly bearish near-term but bullish if supports hold, with risk-reward tilting toward longs on dips given MVRV at 2.6.

Turning to Ethereum (ETH/USDT on Binance, Image 5: Daily chart at $4,444.98 down 3.24%, in an uptrend channel with breakout potential from a symmetrical triangle). ETH’s setup shows resilience despite the week’s losses, holding the ascending trendline from June’s $3,200 low, though the pullback from $4,945 ATH has tested the 50-day MA at $4,400 as support. Multiple buy (“B”) signals mark bounces at $4,300 levels, contrasting sell (“S”) points at highs, forming a falling wedge pattern with red downtrends and teal uptrends. Volume spiked on downside but tapered, suggesting exhaustion, while RSI at 48 nears oversold territory without divergence, and MACD crossover remains negative but flattening. Bollinger Bands contract, a precursor to squeezes where ETH historically expands 25-35% post-consolidation, as in 2021’s DeFi rally.
Outlook scenarios feature an uptrend continuation above $4,500 targeting $4,800-$5,200, propelled by ETF inflows of $320M weekly and staking yields at 4.1% drawing institutions. The ETH/BTC ratio at 0.038, down from 0.04, could rebound to 0.08, implying $9,000 ETH, per Bloomberg analysts. Downtrend risks if breaches $4,300, aiming for $4,000 (100-day MA) or $3,600, with high volatility from options expiry (implied vol at 62%) and DeFi TVL contractions to $43B. Sideways action in $4,300-$4,500 may prevail if macro data disappoints, fostering alt rotations. The bias is neutral-bullish medium-term, as ETH’s smart contract dominance (75% market share) provides a utility premium over BTC.

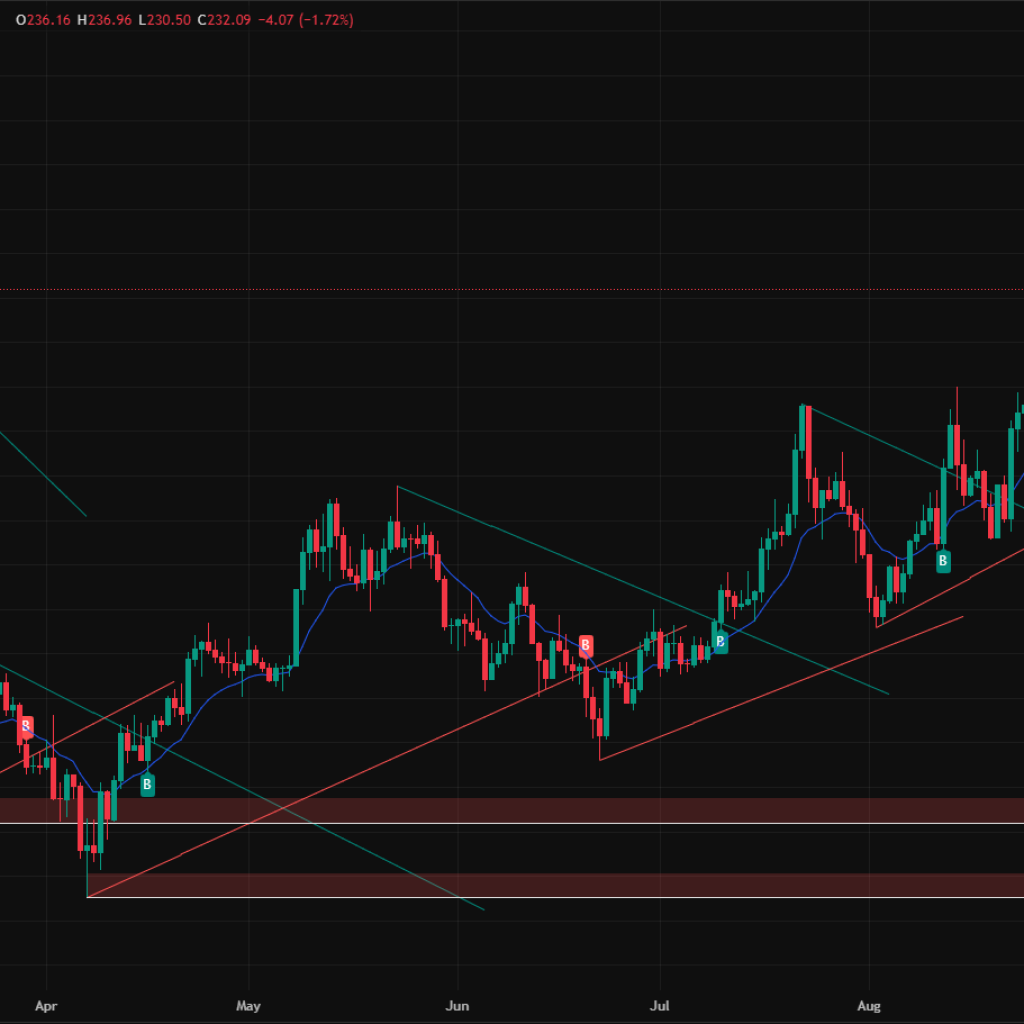
Solana (SOL/USDT on Binance, Image 6: Daily chart at $236.16 down 1.72%, in a rising channel since March with higher highs and lows). SOL’s chart displays corrective pressure within its uptrend, retreating from $250 resistance to test channel support at $220. Buy (“B”) annotations at $225 bounces highlight buyer defense, while RSI at 54 remains above neutral, MACD bullish despite histogram fade, and Bands widening for volatility. DeFi TVL at $5.2B, down 5%, reflects risk aversion, but daily users at 950K sustain narrative.
Scenarios include uptrend momentum reclaiming $240 for $260-$280 targets, leveraging VanEck ETF progress and 2021-like 250% gains in alt seasons. Downtrend below $220 to $200 (200-day MA), with high volatility (±7-10%) from memecoin flows. Sideways in $220-$240 if BTC drags. Bias: Bullish, SOL’s speed edges competitors.

XRP (XRP/USDT on Binance, Image 7: Daily chart at $2.9701 down 2.36%, in a descending triangle nearing resolution). XRP consolidates between $2.80 support and $3.10 resistance, with RSI 46 neutral, volume low pre-breakout. ODL volumes steady at $1.2B daily.
Outlook: Uptrend breakout above $3.10 to $3.40-$3.80 on SWIFT tests. Downtrend sub-$2.80 to $2.60. Sideways low volatility pending catalysts like ETF filings. Bias: Neutral, volume surge key.
The technical outlook favors cautious optimism, with corrections offering entries for Q4 upside.
Institutional Inflows: Steady Amid Corrections
Institutional participation provided a buffer this week, with spot ETF inflows totaling $720 million—down from $1.048B but still positive for the third straight week. BlackRock’s IBIT led with $420M for BTC, while ETHA added $300M, reflecting diversified bets. Pensions and corporates continued stacking: Michigan fund increased ARKB to $12M, Harvard held $116M in IBIT. Bitwise reported institutions buying BTC at 3.5x mining rate, with on-chain data showing 10,000 BTC added to ETF wallets. These flows align with chart supports, preventing deeper dives, and RSI neutrality suggests entry opportunities. As Coinbase CEO Brian Armstrong noted, “Market structure bills are imminent,” potentially unlocking more capital.
Macroeconomic Backdrop: Inflation Data Tempers Optimism
U.S. August CPI rose 2.6% YoY (vs. 2.5% expected), core at 3.2%, cooling rate-cut bets to 75% for 50bps in September per CME. Unemployment at 4.2% and wages up 0.4% raised stagflation fears, pressuring equities (S&P -1.2%) and crypto correlations. China’s 1T yuan stimulus buoyed sentiment briefly, but DXY rebound to 98.5 weighed on risk assets. Tariffs on chips escalated, boosting gold to $3,500/oz, with Saylor commenting on BTC’s superiority. BTC’s resilience at channel lows during CPI release highlights hedge appeal, though 200-day MA at $80,000 remains distant floor in severe scenarios.
Policy Wins: Advancements Bolster Legitimacy
Trump’s American Bitcoin Corp raised $30M, eyeing Nasdaq debut, while orders probed bank discrimination with $1M fines. SEC’s staking pivot fostered DeFi, with Lido TVL up 8%. Pakistan’s licenses to 5 exchanges boosted volumes 20%, Brazil allocated 2% reserves to BTC ($7.4B). SWIFT’s XRP trials for payments could integrate $5T flows. Google’s L1 for custody onboarded 500K users, marking enterprise entry. These developments, per Crypto Council reports, solidify crypto’s $4T status.
Ethereum’s Resurgence and Flippening Debate
ETH’s consolidation at $4,297 held key supports, with ETF inflows $300M sustaining staking at 28M ETH locked. Forecasts from Lee eye $8,000 by year-end on treasury adoption. ETH/BTC at 0.038 targets 0.09 ($11K ETH). Lubin on flippening cites utility; Chainlink treasury $1.3M; TRON $620B stablecoins.
Bitcoin’s 4-Year Cycle: Corrections Within Trend
Hougan on ETF damping, but polls 62% see cycle intact. Chart parallels: post-halving surge, Q3 dip, Q4 peak at $140K-150K.
Other News: Milestones and Incidents
Gemini IPO at $5B; Polymarket $10B raise; Shibarium patch after $2.4M hack; Ethereum PSE for privacy; Solana Firedancer reduces fees 35%; Jupiter Lend $120M TVL; Bitcoin Ordinals debate soft forks; Base DEX 1.2M trades.
Conclusion: Pullback Sets Stage for Rebound
This week tested highs with corrections, cap to $3.97T, but institutions and policy support foundations. BTC $120K if reclaims $114K; bearish sub-$110K. ETH $4,800, SOL $260, XRP $3.40. Ahead: FOMC, unlocks. Dip-buying opportunity in resilient market. Overall, while volatility tested supports this week, institutions, policy wins, and historical seasonality suggest the pullback may be a healthy reset before potential Q4 upside.


