Weekly Crypto Recap Sept 8–15: Altcoin Season, $4T Cap
Weekly Crypto Recap Sept 8–15, 2025 shows the market breaking past $4T as altcoin season takes hold. Bitcoin stayed steady, while Ethereum, Solana, and XRP led the charge. Daily volume jumped 45% to $129.2B, ETF inflows topped $1B, and sentiment turned neutral with the Fear and Greed Index at 51.
A Week of Altcoin Dominance and Broad Recovery
Last week, from September 8 to 15, 2025, the crypto market staged a powerful surge that many analysts now define as the beginning of a full-fledged altcoin season. Total capitalization expanded from $3.83 trillion to $4.04 trillion, reclaiming the $4T threshold and posting a 5.6% weekly gain. September is often associated with weakness for Bitcoin, yet this time the trend reversed. Daily trading volume averaged $129.2 billion, up 45% from the prior week, signaling strong engagement from both institutional and retail participants.
Bitcoin closed the week at $115,604, gaining 4.2%, a move that anchored sentiment across the market. Ethereum ended at $4,635, Solana jumped to $243, and XRP advanced to $3.04, while BNB held near $933. The Altcoin Season Index rose to 73, highlighting the rotation into alts. The Fear and Greed Index climbed from 42 to 51, reflecting a shift in mood as liquidity improved and altcoins took control of momentum.
Bitcoin moved steadily from sub-$110,000 levels to $115,604 by the end of the week, supported by modest daily gains and a firm weekly trend. Ethereum consolidated near $4,635 after easing from its August high of $4,945 but still added 3.1% across the week. Solana delivered one of the strongest performances, up 7.8% to $243.23, supported by new DeFi protocols and active memecoin flows. XRP closed at $3.0465, a 5.9% weekly rise driven by renewed optimism on ETF approvals and Ripple’s legal progress. BNB traded at $933.03, a sign of stability within blue-chip altcoins.
Trading activity strengthened the picture. Daily volume reached an average of $129.18 billion, showing broad participation. The Fear and Greed Index settled at 51, up from 42, while liquidations fell to $150 million, a sharp decline from August peaks. The week’s key themes included altcoins outperforming Bitcoin by more than twofold, robust ETF inflows led by BlackRock’s IBIT and ETHA, and macro tailwinds from U.S. job data that increased the probability of a September rate cut to 85 percent. Adoption signals reinforced the positive momentum, as India overtook the U.S. in Bitcoin adoption metrics and Pakistan issued its first crypto licenses.
Instead of weakness, September delivered a rebound similar to 2021, when Solana surged more than 40% under favorable macro conditions. On-chain flows confirmed the trend. Stablecoin supply rose 2.3 percent to $160 billion, with USDC inflows up 40 percent year-on-year. Whale addresses holding more than 1,000 BTC accumulated an additional 15,000 coins, marking a clear shift from August’s distribution. Risks remain with $4.5 billion in token unlocks expected before month-end and ongoing trade tensions between the U.S. and China, yet the overall setup now points toward accumulation for the next leg higher. Large investors are positioning for Q4, and Bitcoin dominance near 56% leaves room for further altcoin expansion if it moves lower.
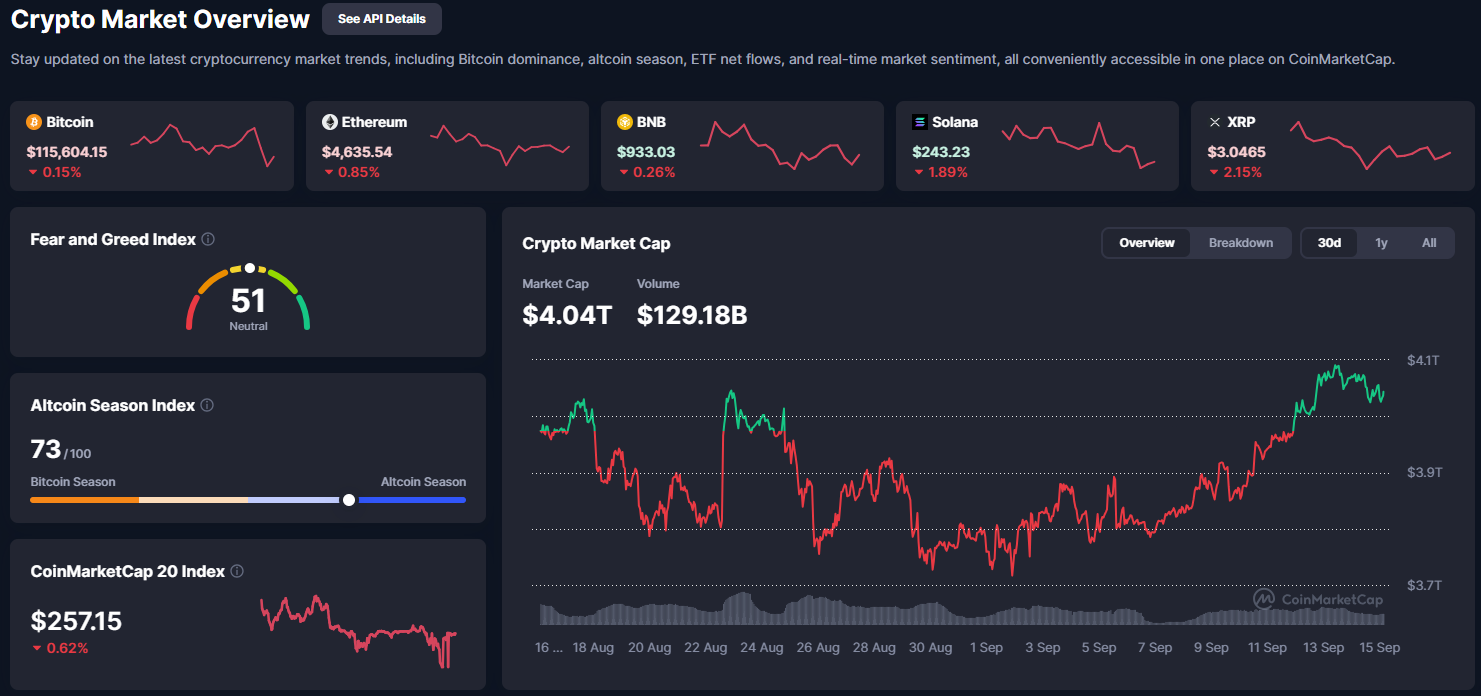
From the CoinMarketCap overview (Image 1), we can see the week’s surge stands out clearly. Total market cap closed at $4.04 trillion, daily volume reached $129.18 billion, the Fear & Greed Index printed 51, and the Altcoin Season Index climbed to 73. The chart shows a sharp mid-week breakout in market cap that lined up with ETF inflow announcements, while rising volume bars confirmed real conviction behind the move.
Compared with last week’s $3.83 trillion close, the 5.6% gain fits the historical pattern of altcoin seasons, where weekly expansions of this size often precede much larger monthly rallies. The dashboard also highlights the contrast between Bitcoin’s steady trajectory and Solana’s sharp volatility, underscoring the rotation into higher-beta assets. This sets the stage for a deeper look at total market cap trends and index behavior.
Analysis of Crypto Total Market Cap and Indices
CoinMarketCap data confirmed the momentum shift. Total capitalization closed the week at $4.04 trillion, with daily volumes at $129.18 billion. Both the Fear and Greed Index at 51 and the Altcoin Season Index at 73 reflected improving sentiment and stronger rotation into alts. The move from the prior week’s $3.83 trillion matched past alt seasons, where similar weekly gains often built into multi-week rallies. The charts highlighted the split in performance: Bitcoin remained steady while Solana delivered sharper swings, underscoring the shift toward higher-beta assets.
The 30 days view showed a clean V-shaped recovery. Market cap briefly fell to $3.7 trillion on September 10, then bounced quickly, finding support at the 50-day moving average around $3.95 trillion. The pattern resembled the resilience seen after the 2020 crash, when quick rebounds turned into extended rallies. Ethereum’s share of total market cap held at 18%, while Solana advanced to 3%, strengthening its role in the Layer-1 landscape. Momentum indicators approached overbought levels with RSI near 65, yet fresh Tether issuance of $2.5 billion signaled that liquidity continues to flow into the system.
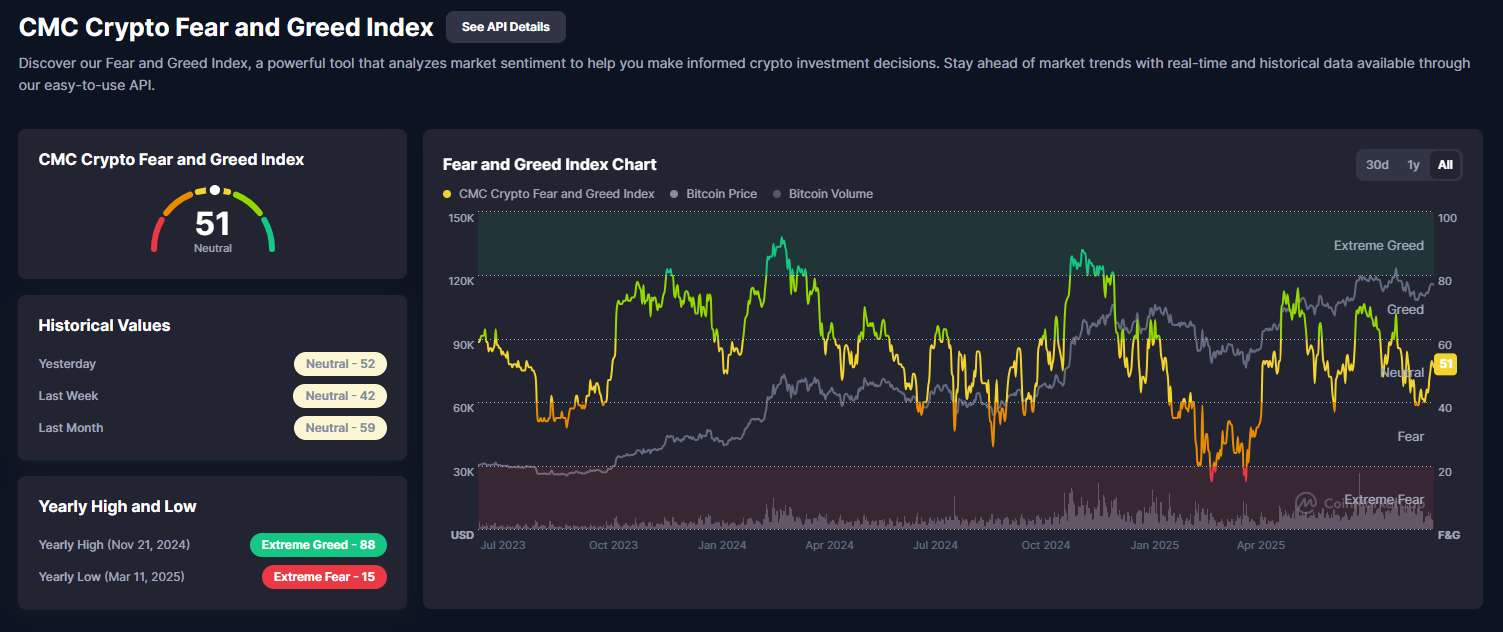
The CMC Crypto Fear and Greed Index closed the week at 51, a clear rebound from 42 the week before. This move into neutral territory has often acted as the springboard for stronger rallies once the index pushes above 60. The accompanying chart showed sentiment diverging from August’s fear-driven sell-offs, with higher prices confirmed by stronger trading volumes.
Readings of 52 yesterday, 42 last week, and 59 a month ago highlight how quickly sentiment has shifted, largely on the back of ETF inflows. Over the past year, the index peaked at 88 in November 2024 during extreme greed and bottomed at 15 in March 2025 during extreme fear. Today’s level looks more like a healthy reset than exhaustion. Historical patterns suggest that neutral sentiment in September often precedes October rallies in the 25–40% range. Supporting indicators reinforce this view: social media activity on X rose 30%, while volatility stayed muted with the VIX at 18. The only caution comes from upcoming token unlocks, which could still inject short-term supply pressure.
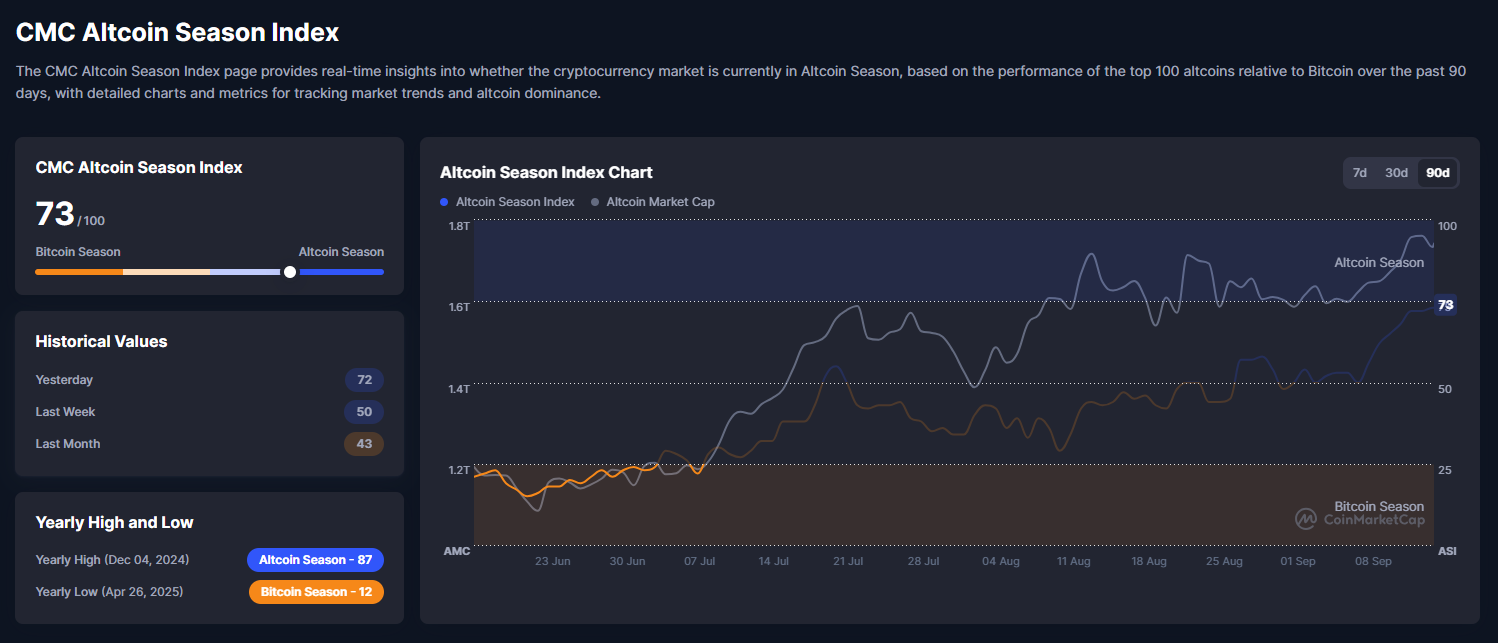
The CMC Altcoin Season Index finished the week at 73/100, making it the standout signal. The index jumped from 50 last week and 43 a month ago, while yesterday’s print at 72 showed momentum still accelerating. On the chart, the blue index line surged alongside the orange altcoin market cap, confirming the shift.
At 73, altcoins have outperformed Bitcoin by 15% over the past 90 days, a pattern reminiscent of the 2017 ICO boom, when the index reached 87 before altcoins delivered 10x gains. The yearly range frames the context: a high of 87 in December 2024 and a low of 12 in April 2025 during Bitcoin season. Current dominance at 1.8% highlights alt strength, and a push above 75 could open the door to 20–50% rallies, similar to the surges of 2021. Across the 7-day, 30-day, and 90-day views, momentum continues to build, with the latest moves closely tied to Solana’s ETF filings.
Technical Analysis and Outlook for Key Tokens
Charts from TradingView and CoinMarketCap as of September 15, 2025, point to a market leaning neutral-bullish. The Fear and Greed Index at 51 reflects balance, while Bitcoin dominance has slipped to 56%. With the Altcoin Season Index at 73, altcoins are taking the lead, and the setup suggests they may continue to decouple if Bitcoin consolidates. The following breakdown looks at BTC, ETH, SOL, and XRP using price action, RSI, moving averages, volume profiles, and on-chain context.
Bitcoin
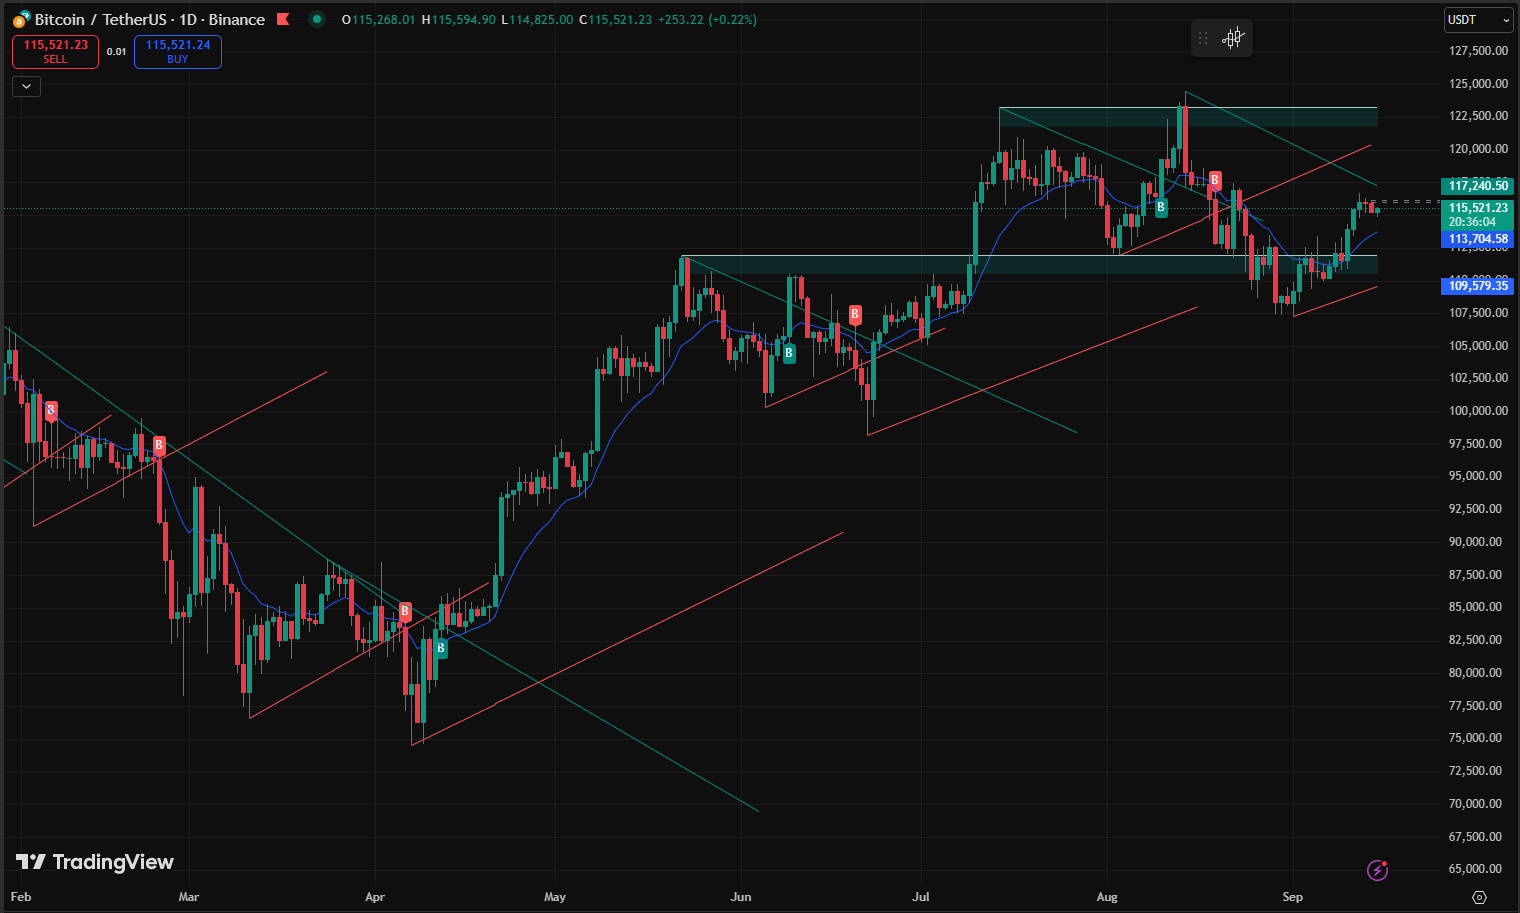
Let’s start with Bitcoin. Bitcoin traded at $115,268, down 0.22% on the day but still inside its rising channel from February lows. Support sits near $112,000, which held through September dips. Since July’s low at $96,000, price has set higher highs and reclaimed the 50-day moving average at $114,000, now working as support. A bullish pennant has formed after August’s rally, with buy signals around $112,500 and resistance near $120,000. Volume has spiked on up moves, RSI stands at 55, and Bollinger Bands are starting to widen, suggesting volatility may increase. Long-term holders control about 75% of supply, while exchange inflows have fallen 20%, signaling continued accumulation.
If Bitcoin holds above $116,000, the next leg targets $122,000–$125,000, in line with the upper channel and post-halving patterns that historically bring 40–80% gains. A drop under $112,000 could test $108,000 or even $100,000 at the 200-day average, with leverage risks evident as open interest remains near $40B. Sideways action between $112,000–$118,000 is also likely in the short term, with ±2–4% swings until a macro trigger arrives. Overall bias stays bullish, with dips into support offering better risk-reward entries.
Ethereum
Ethereum traded at $4,604, down 0.56% but maintaining strength above $4,500. The uptrend from $3,800 remains intact, and price is holding above the 50-day average at $4,600. August’s peak at $4,945 still marks resistance, but the structure shows a bull flag pattern with multiple successful retests near $4,400. RSI at 53 and a bullish MACD crossover back the case for further upside, while widening Bollinger Bands hint at a potential expansion phase. On fundamentals, staking yields hover at 4.2%, Layer-2 TVL stands at $45B, and gas usage has risen 15% with network activity.
A push above $4,700 could open the way toward $5,000–$5,500, supported by ETF inflows of $406M last week. ETH/BTC at 0.04 still has room toward the 2021 peak at 0.085, which would imply $12,000 ETH at current Bitcoin prices. Downside levels to watch are $4,400, $4,000 at the 100-day MA, and $3,800. Bias remains bullish, with Ethereum positioned to outperform if altcoin momentum continues.
Solana
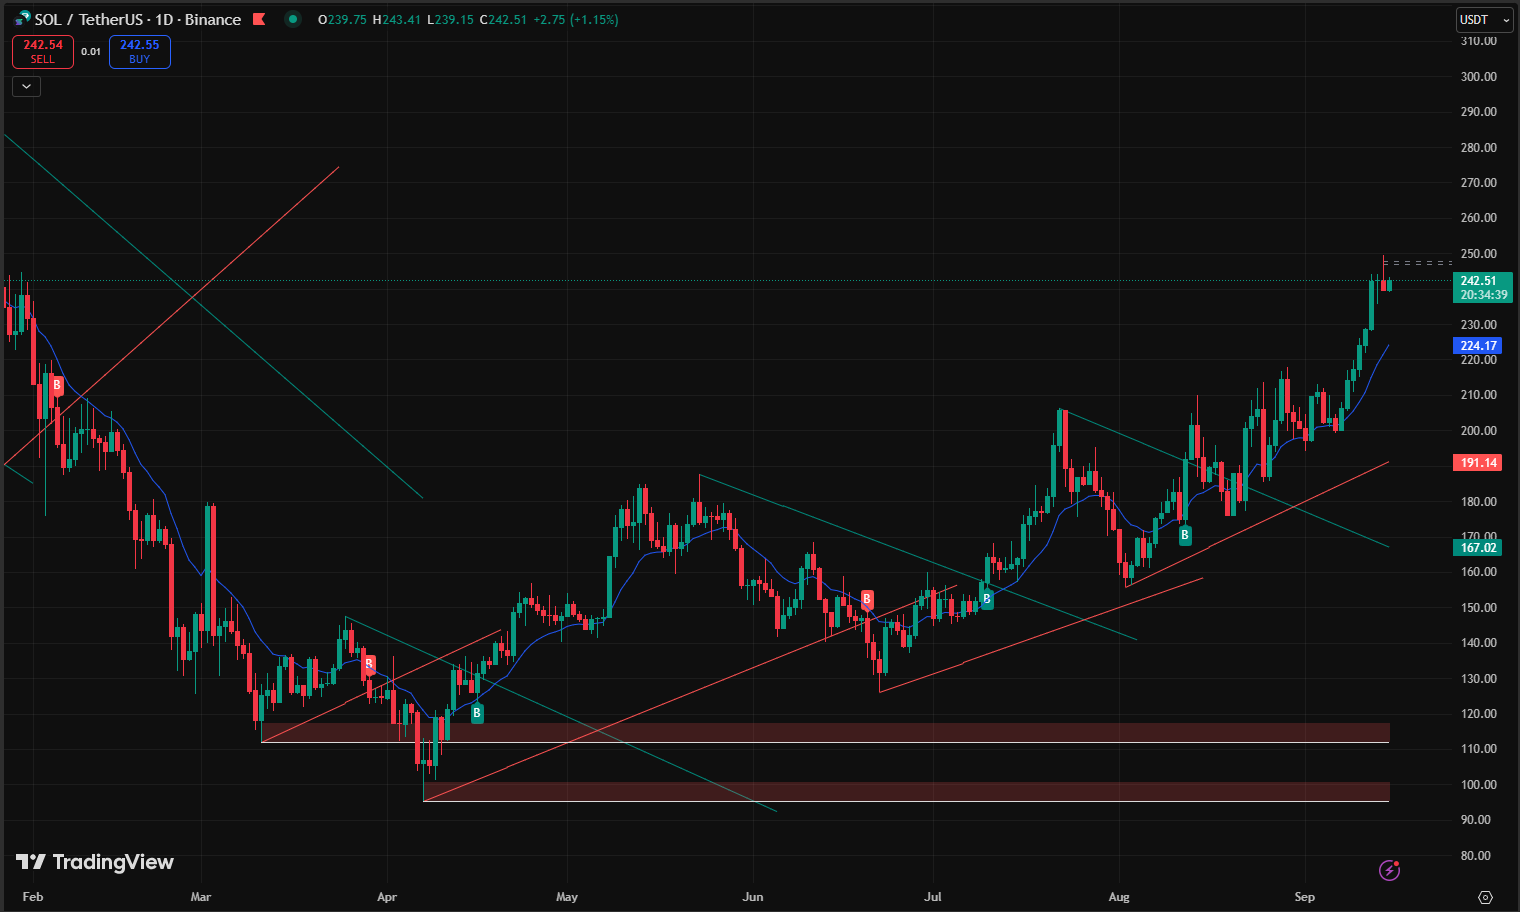
Solana traded at $239.75, up 1.15%, and continues to lead the altcoin rotation. Price broke through $240 resistance within a rising channel that began in March. Support sits near $230, with multiple buy signals recorded around $235. RSI is firm at 60, MACD prints bullish, and volume confirms strong interest. Bollinger Bands have expanded, suggesting volatility is picking up. On-chain, Solana’s DeFi TVL has grown to $5.5B, daily active users passed 1M, and memecoin volume increased by 30%.
The next target zone is $260–$300, which lines up with both ETF speculation and historical alt season rallies where Solana often posted outsized gains. A break below $230 would put $210 in play, though the bias stays strongly bullish given ecosystem strength and anticipation of the Firedancer upgrade.
XRP
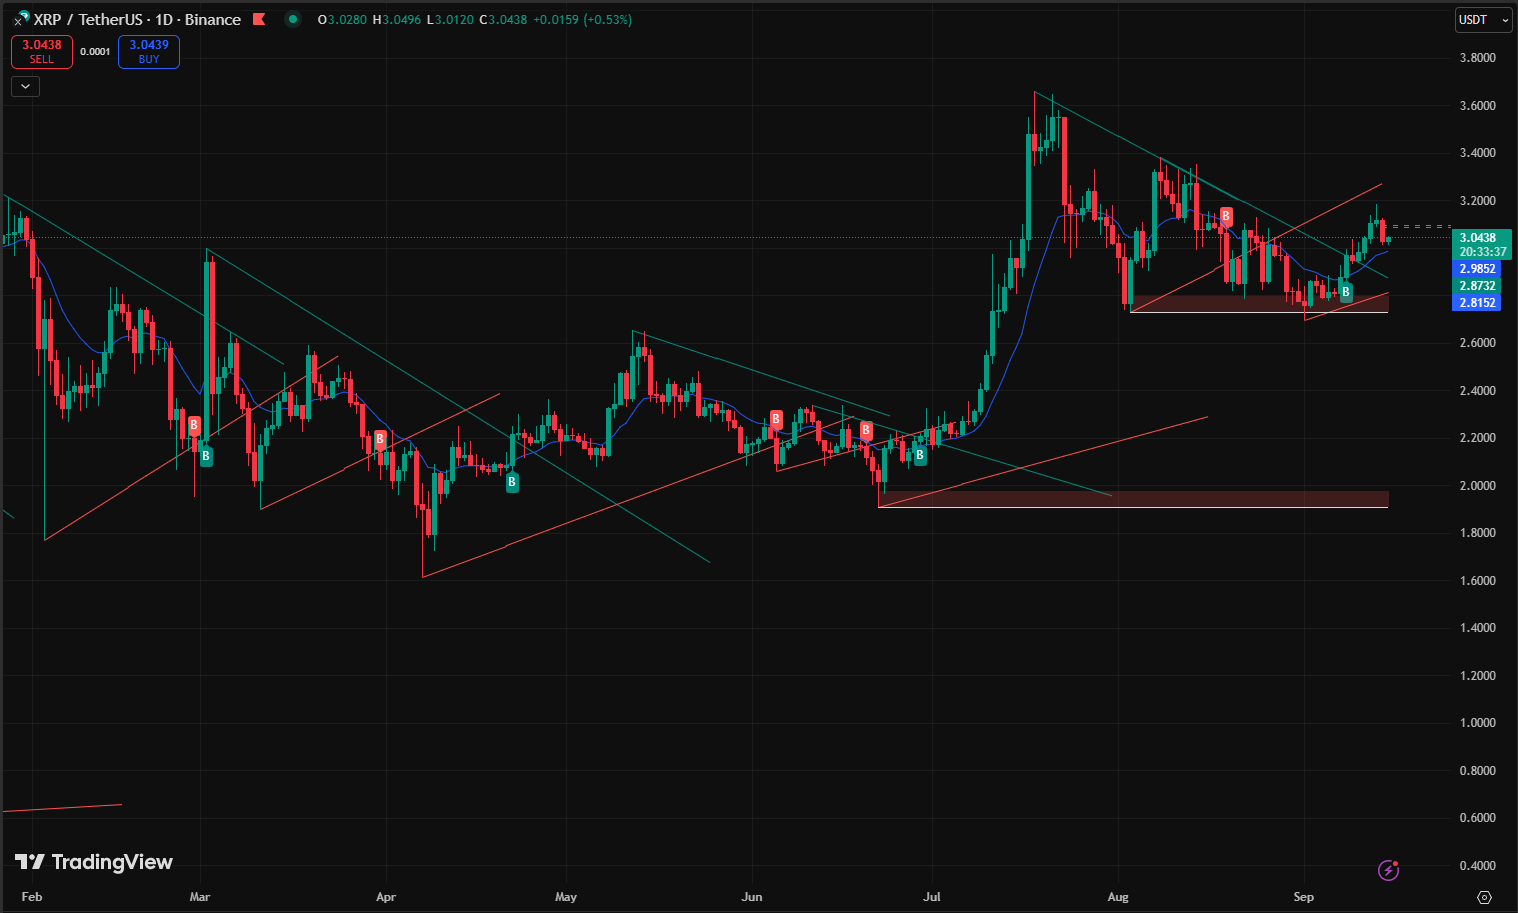
XRP closed at $3.028, down 0.53%, and is coiling in a descending triangle. Resistance stands near $3.10, while support holds at $2.90. RSI is neutral at 50, and trading volumes remain light as the token waits for a catalyst. However, ODL transaction volume rose 25%, and Ripple’s SEC momentum continues to add confidence.
A breakout above $3.10 would set sights on $3.50–$4.00, especially if ETF or regulatory headlines arrive. If support fails at $2.90, price could revisit $2.70. In the meantime, XRP looks neutral-bullish, with traders watching for a confirmed move on volume.
Altcoin season remains the driver of opportunity. Bitcoin offers stability, Ethereum and Solana show stronger growth momentum, and XRP is building for potential catalysts. The environment favors selective positioning, with tight risk management given higher volatility.
Institutional Inflows: ETFs Surge Amid Adoption
Spot ETFs drove momentum last week, recording $1.048 billion in net inflows, the strongest since July. BlackRock’s IBIT accounted for $642 million, while ETHA added $406 million, extending a five-day streak of positive flows. The split highlighted Ethereum’s growing appeal, with staking-focused products attracting 60 percent of new capital even as Bitcoin kept the larger trading volume. Institutions bought BTC at four times the mining rate—roughly 900 BTC a day, according to Bitwise. Pensions also deepened exposure, with Michigan’s fund tripling its ARKB holdings to $11 million. Corporates followed, with Unitronix adding 5.5 BTC to its balance sheet. Universities joined the trend, as Harvard allocated $116 million to IBIT and Brown added $13 million, underscoring academia’s quiet embrace of crypto. On-chain, ETF-linked wallets now hold 500,000 BTC, up 10% from previous levels, helping offset selling pressure from token unlocks.
Macroeconomic Backdrop: Job Data Boosts Cuts
August U.S. nonfarm payrolls showed 142,000 jobs added, short of the 161,000 forecast. Unemployment held at 4.2%, while wage growth printed 0.3%, data that pushed Fed cut probabilities to 85% for September, according to CME FedWatch. Inflation also remained contained, with core PCE steady at 0.3% month-over-month. The weaker data weighed on the dollar, sending the DXY to 97.8, its lowest in weeks, and funneled capital toward risk assets. Abroad, China unveiled a 1 trillion yuan stimulus package, lifting equities and providing indirect support for crypto. U.S.–China tariffs escalated on semiconductors, shaving 2% off chip stocks but boosting Bitcoin’s role as a “digital gold” hedge. As Michael Saylor remarked on Bloomberg, “Tariffs accelerate the shift to borderless assets.” On charts, BTC respected its channel support during the data release, with the 200-day average near $80,000 providing a clear psychological floor. In stagflation scenarios, Bitcoin’s scarcity narrative remains compelling, with correlations to the Nasdaq sitting near 0.75.
Policy Wins: Trump Pushes Bitcoin, Regulators Soften
Policy developments further strengthened sentiment. President Trump’s pro-crypto stance dominated headlines as the American Bitcoin Corporation, backed by his sons, raised $25 million ahead of a planned Nasdaq listing designed to tokenize BTC reserves for retail investors. Executive orders extended crypto’s reach into retirement accounts, mandating penalties for banks that deny services to crypto firms. The SEC eased its stance on staking, classifying liquid staking protocols such as Lido as non-securities, opening space for ETH and SOL ecosystems. Internationally, Pakistan issued its first crypto licenses, including one to Binance, marking a regulatory milestone. In Brazil, lawmakers proposed allocating 5% of national reserves to Bitcoin, equivalent to $18.6 billion. SWIFT meanwhile advanced XRP integration tests for cross-border settlements, potentially unlocking $10 trillion in volume. Google announced a new Layer-1 blockchain for institutional custody, integrated with Firebase, which could onboard more than a million developers. The shift marked a striking contrast with the hostility of 2022, signaling crypto’s legitimacy as a $4 trillion asset class.
Ethereum’s Resurgence and the Flippening Debate
Ethereum closed the week at $4,635 after holding support near $4,500, finishing with a 3.1% gain despite a small daily dip. ETF inflows into ETHA reached $406 million, lifting staking yields to 4.2% and bringing in $2 billion in fresh deposits. Fundstrat’s Tom Lee projects $7,500 ETH by Q4, pointing to treasury demand and Layer-2 adoption, with L2 TVL at $45 billion. The ETH/BTC ratio improved to 0.04 from 0.039 and aims for the 0.085 peak of 2021, which would equal $12,000 ETH at current Bitcoin prices. ConsenSys founder Joe Lubin said the flippening could come within a year, noting ETH’s $512 billion market cap against Bitcoin’s $2.3 trillion. Ethereum’s 80% share of DeFi and a 25% rebound in NFT volumes on OpenSea strengthen the case. Chainlink’s Reserve treasury collected $1.2 million in LINK, while TRON’s stablecoin rails processed $600 billion monthly, accounting for 50% of USDT volume. Jack Dorsey promoted Lightning Network growth, but Ethereum’s contract layer continued to give it an edge.
Bitcoin’s 4-Year Cycle: ETFs Enhance Upside
The debate over Bitcoin’s four-year cycle gained momentum. Bitwise CIO Matt Hougan argued that ETFs have reduced volatility, cutting drawdowns from 80% to 40% while maintaining upside potential. Still, a community poll of more than 9,400 respondents showed 61% expect the cycle to continue. Post-halving price action has followed a familiar path: an early surge to $120,000, a correction to $96,000, and now a renewed climb. The structure mirrors 2017 and 2021, when April halvings set up Q3 consolidations before Q4 peaks. With ETFs now holding 5% of supply, volatility may compress but upside could amplify, with Fibonacci extensions pointing to $150,000–$160,000 by year-end. Corporate treasuries add stability, led by MicroStrategy’s 250,000 BTC, while on-chain HODL waves suggest accumulation cycles remain intact.
Other News: IPOs, Raises, and Ecosystem Milestones
Beyond price charts, the ecosystem advanced. Gemini filed for a confidential Nasdaq IPO at a $4.75 billion valuation, signaling deeper crossover with traditional finance. Polymarket raised $9–10 billion in a token sale, supported by a 50% rise in election-related trading. Security headlines included a $2.4 million exploit on Shibarium, patched within hours, and Ethereum’s PSE privacy roadmap, which targets 2026 for zk-SNARK-based confidential transactions. On Solana, the Firedancer validator client launched in testnet, cutting congestion by 40%. Jupiter debuted its Lend protocol with $100 million TVL, while debates flared over Bitcoin Ordinals consuming 10% of block space, prompting soft fork proposals. Coinbase’s Base DEX crossed 1 million trades, excluding New York users, expanding its U.S. reach.
Conclusion: Alt Season Fuels the Next Leg
The week confirmed a market turning point. Capitalization pushed back above $4 trillion, ETF inflows accelerated, and policy support strengthened the trend. Bitcoin could reach $122,000 if it holds above $112,000, with risk of a pullback to $108,000 if that level fails. Ethereum targets $5,500 with ETF-driven momentum, Solana eyes $300 on ecosystem growth, and XRP has room toward $4 with regulatory catalysts. Risks remain, especially large token unlocks and volatility around the FOMC meeting, but the setup favors accumulation. With September’s CPI release and the Fed decision approaching, institutional players appear to be positioning quietly for continued growth into Q4.