What is Technical Analysis in Crypto Trading? A-Z Guide for Beginners

Learn crypto technical analysis from basics to advanced. Guide to reading candlestick charts, support/resistance levels, moving averages with practical examples for new traders.
What is Technical Analysis in Crypto Trading? /A comprehensive guide for beginnersTechnical analysis is one of the fundamental skills that any trader in the cryptocurrency market needs to master. It's a method of studying statistical trends over time to predict future price movements of assets based on historical trading data. {"align":"center"}
Essential crypto technical analysis chart patterns | Source: Social Capital Markets
{"align":"center"}To help you visualize this concept, technical analysis is like a doctor examining test results to diagnose an illness. Instead of blood tests, traders use price charts and trading volume to "diagnose" market trends.
It's important to understand that this method isn't exclusive to cryptocurrencies. Technical analysis is widely used in stock trading, commodities, foreign exchange, and other financial assets.
Core Principles of Technical AnalysisTechnical analysis is built on a fundamental belief: all known information about an asset is reflected in its price. This means the current price represents the fairest reflection of the asset's true value.
Imagine Bitcoin's price like your body temperature. When there's good news (like a major company accepting Bitcoin), the "temperature" rises. When there's bad news (like new restrictive regulations), the "temperature" drops. Technical analysis helps us read this "thermometer."
Traders using technical analysis also pay attention to market psychology because they believe historical trading patterns tend to repeat themselves. Humans exhibit herd mentality - when they see prices rising, many people want to buy in (FOMO), and when they see prices falling, many people panic and sell.
Basic Concepts in Technical Analysis /Bullish and Bearish TrendsBefore diving into specific tools, you need to understand these two fundamental concepts: {"align":"center"}
Understanding bullish and bearish market psychology | Source: Token Metrics
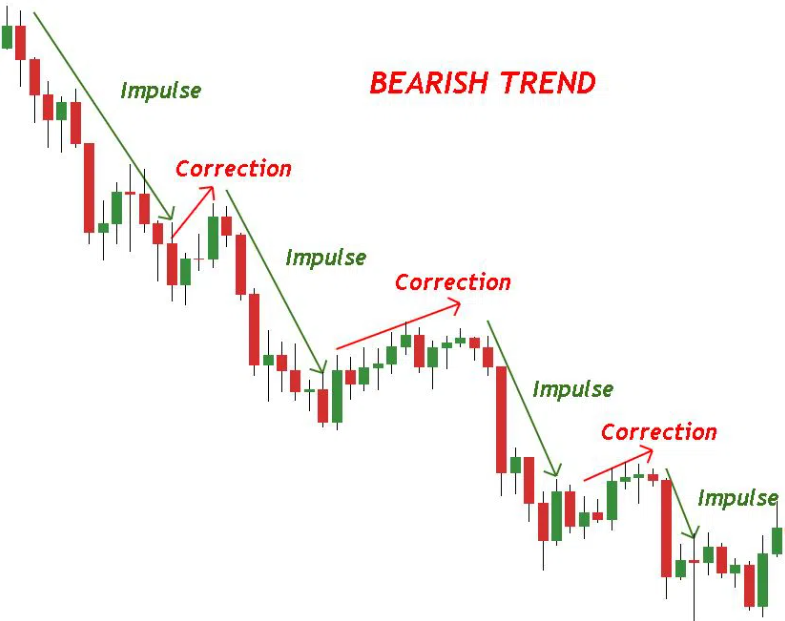
{"align":"center"}Bullish trend: The market has an upward price tendency over a period of time. It's called "bullish" because a bull attacks by thrusting its horns upward from below.
Bearish trend: The market has a downward price tendency. It's called "bearish" because a bear attacks by swiping its claws downward from above.
Candlestick Charts
Candlestick charts are the most important visual tool in technical analysis. Each "candle" on the chart tells you four crucial pieces of information within a specific time period: {"align":"center"}
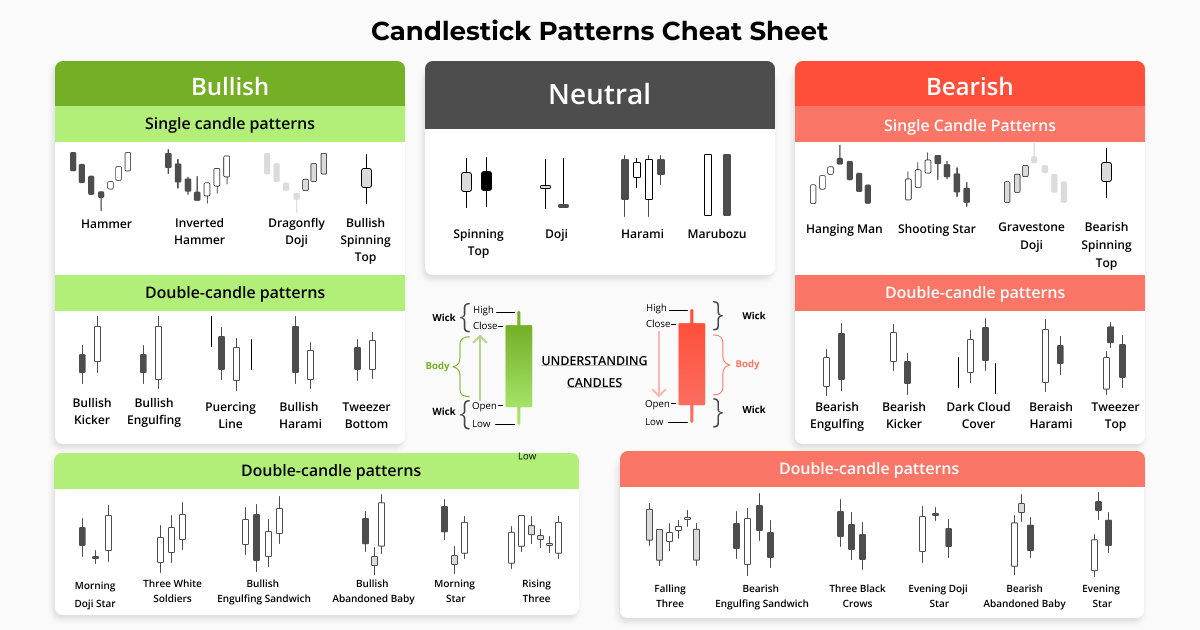
Comprehensive guide to crypto candlestick patterns | Source: GoodCrypto
{"align":"center"}- Opening price: The price at the beginning of the time period
- Closing price: The price at the end of the time period
- Highest price: The peak price during that time period
- Lowest price: The lowest price during that time period
The color of the candle is also very important:
- Green (or white) candle: Closing price higher than opening price (price increase)
- Red (or black) candle: Closing price lower than opening price (price decrease)
Support and Resistance Levels
/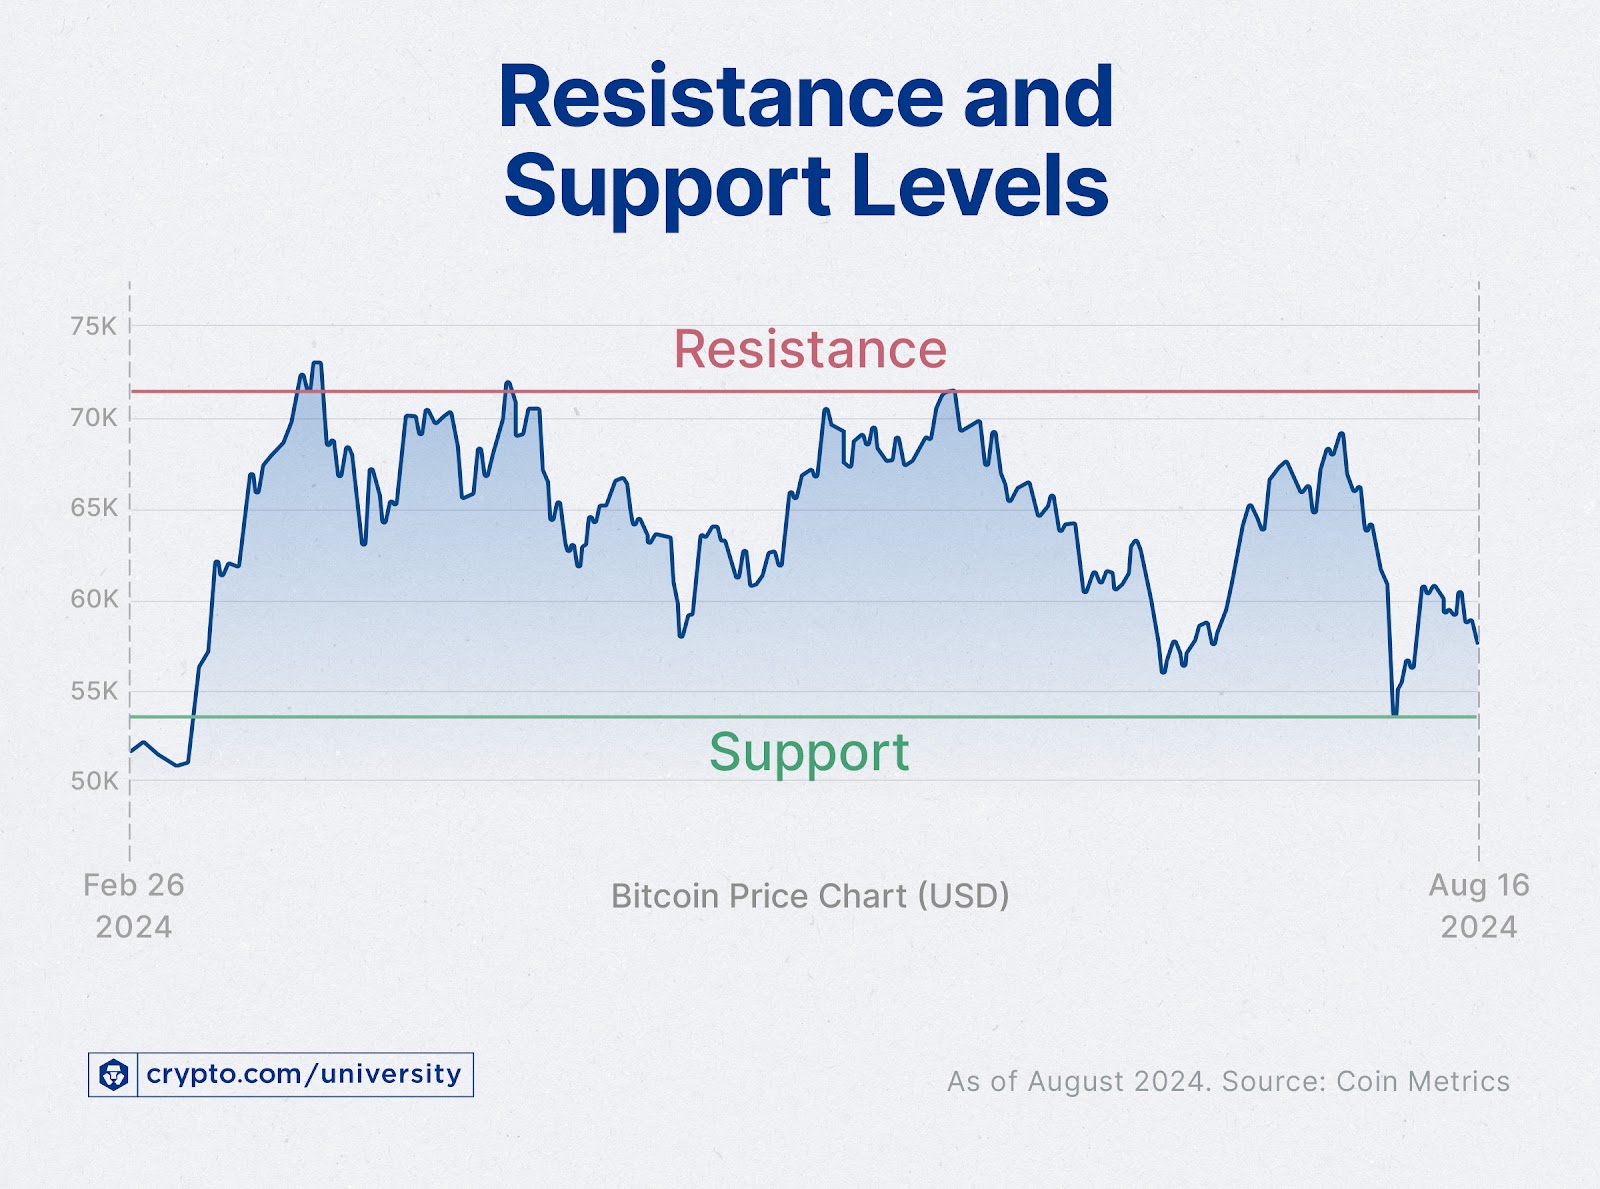
Bitcoin support and resistance level identification | Source: Crypto.com
{"align":"center"}Support level: A price level where there's significant buying pressure, making it difficult for the price to fall below this level. Think of it as a "cushion" that prevents the price from falling further.
Resistance level: A price level where there's significant selling pressure, making it difficult for the price to rise above this level. It's like a "wall" that prevents the price from climbing higher.
For example: If Bitcoin repeatedly tests the $50,000 level but cannot break through, then $50,000 would be considered a resistance level. Conversely, if Bitcoin repeatedly drops to $45,000 and then bounces back up, then $45,000 is a support level.
Moving Averages
Moving averages help "smooth out" price fluctuations so we can see the overall trend more clearly. This is like looking at monthly weather trends instead of just today's weather. {"align":"center"}
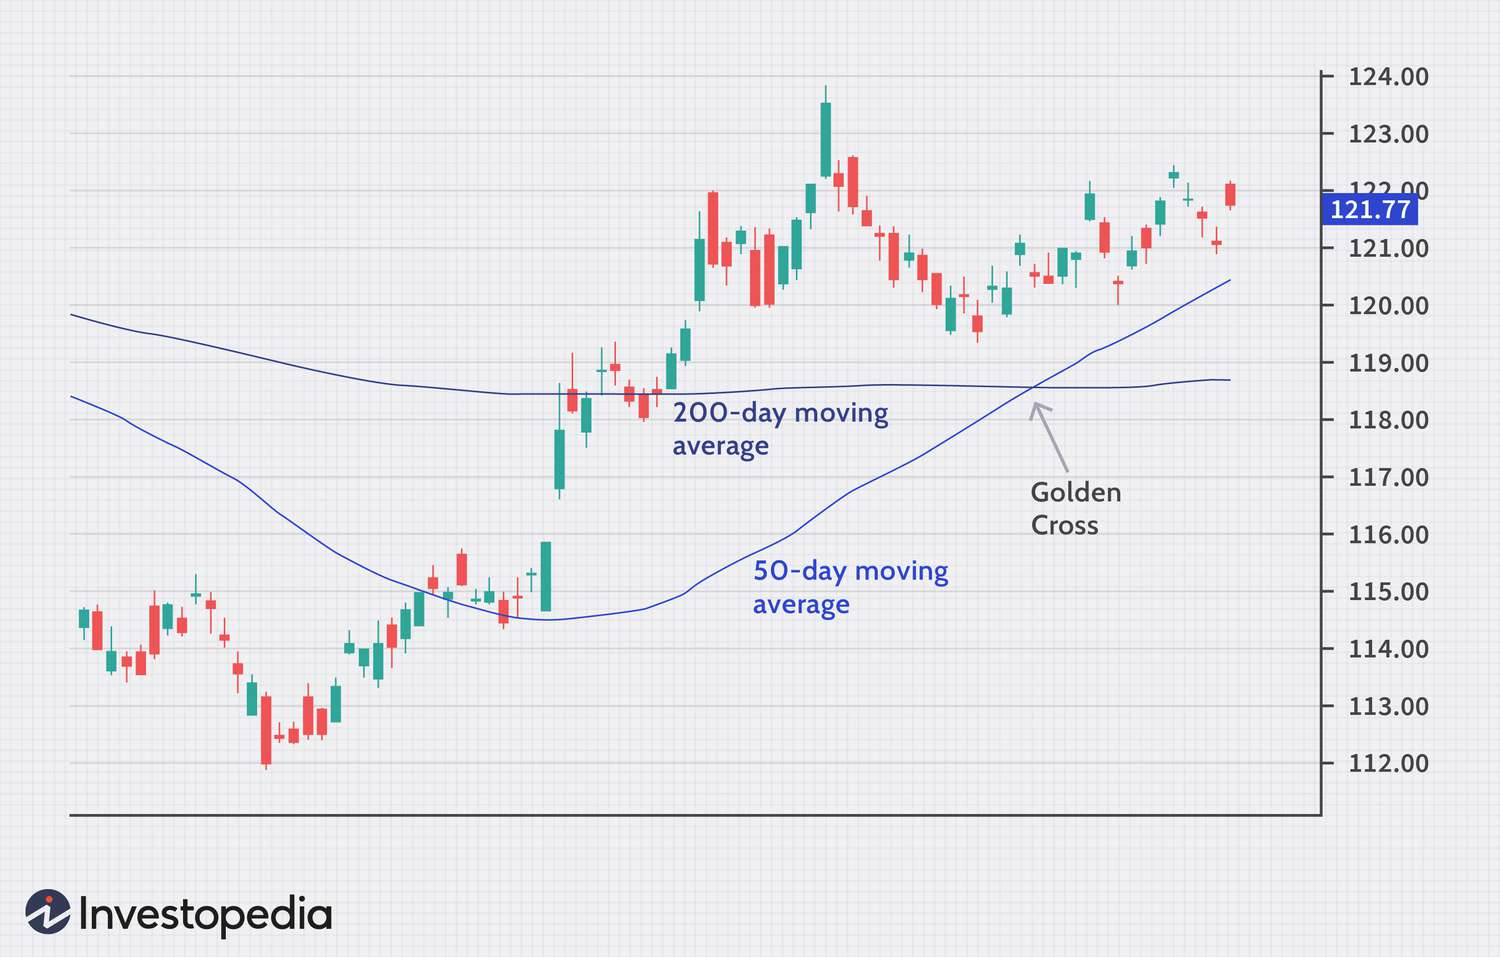
Golden cross vs death cross signals | Source: Investopedia
{"align":"center"}The two most common types of moving averages:
- 50-day MA: Average price over the last 50 days
- 200-day MA: Average price over the last 200 days
Golden Cross signal: When the 50-day MA crosses above the 200-day MA, it often signals a strong upcoming uptrend.
Death Cross signal: When the 50-day MA crosses below the 200-day MA, it often signals an upcoming downtrend.
Applying Technical Analysis in Practice /Step 1: Identify the Overall TrendBefore trading, look at larger time frames (1 day, 1 week) to see whether the market is in an overall uptrend or downtrend. This is like checking the overall map before deciding on your detailed route.
Step 2: Find Entry Points
Use support and resistance levels to identify buying and selling points:
- Buy near support levels in an uptrend
- Sell near resistance levels in a downtrend
Step 3: Confirm with Other Indicators
Don't rely on just one tool. Combine multiple indicators to increase accuracy:
- Check trading volume - high volume usually confirms strong trends
- Use oscillating indicators like RSI to avoid buying in overbought zones or selling in oversold zones
Each candle tells a story about the battle between buyers and sellers: {"align":"center"}
Key reversal candlestick patterns explained | Source: Alchemy Markets
{"align":"center"}- Long-bodied candles: Show that one side (buyers or sellers) has clear dominance
- Short-bodied candles: Show balance between buying and selling forces
- Long-wicked candles: Show there was strong price testing but couldn't maintain the level
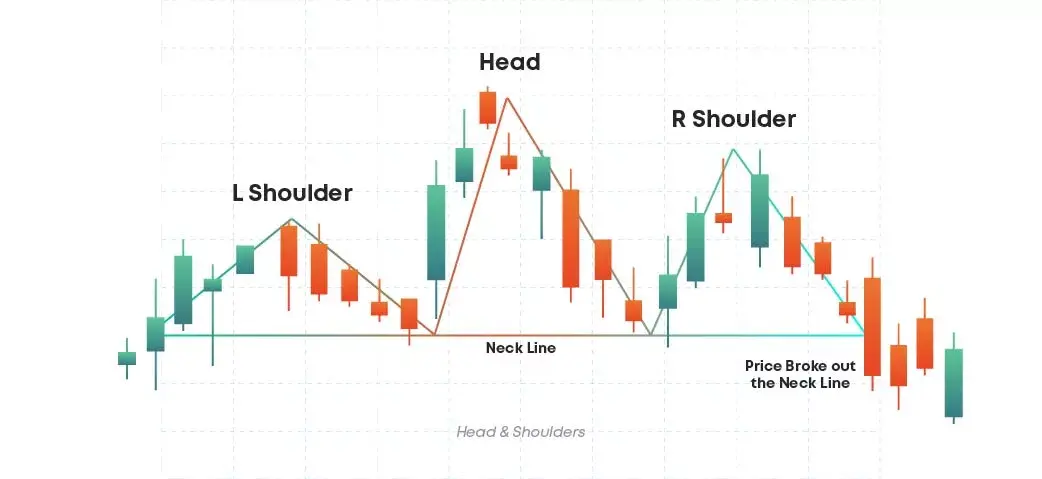
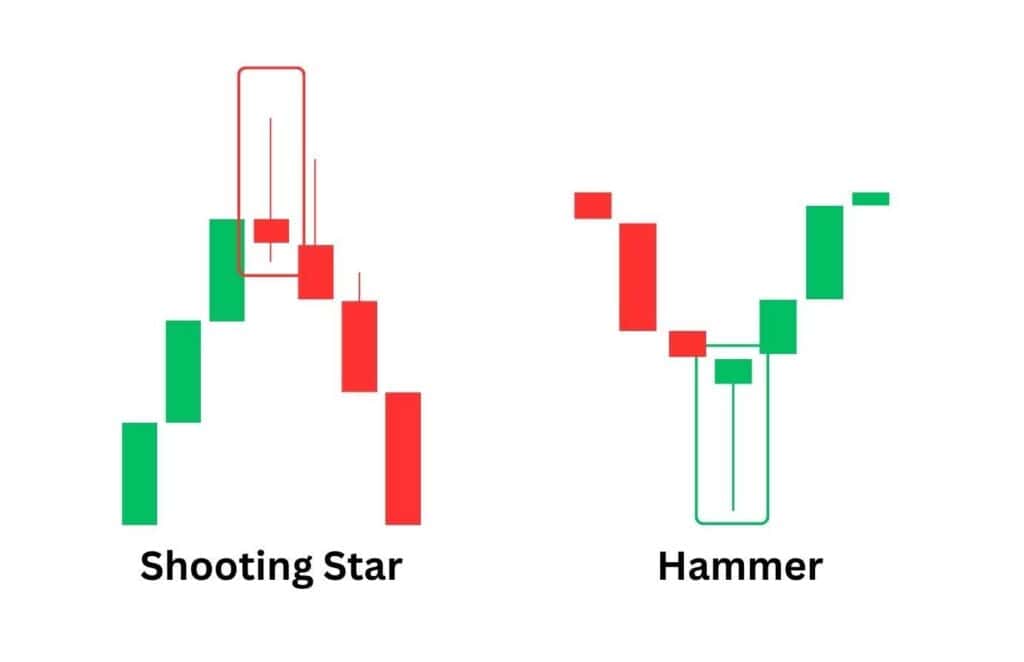
Recognizing Reversal Patterns
Some important candlestick patterns that beginners should know:
- Hammer: Appears at the end of a downtrend, signals possible upward reversal
- Shooting Star: Appears at the end of an uptrend, signals possible downward reversal
- Doji: A candle with opening and closing prices nearly equal, showing market indecision
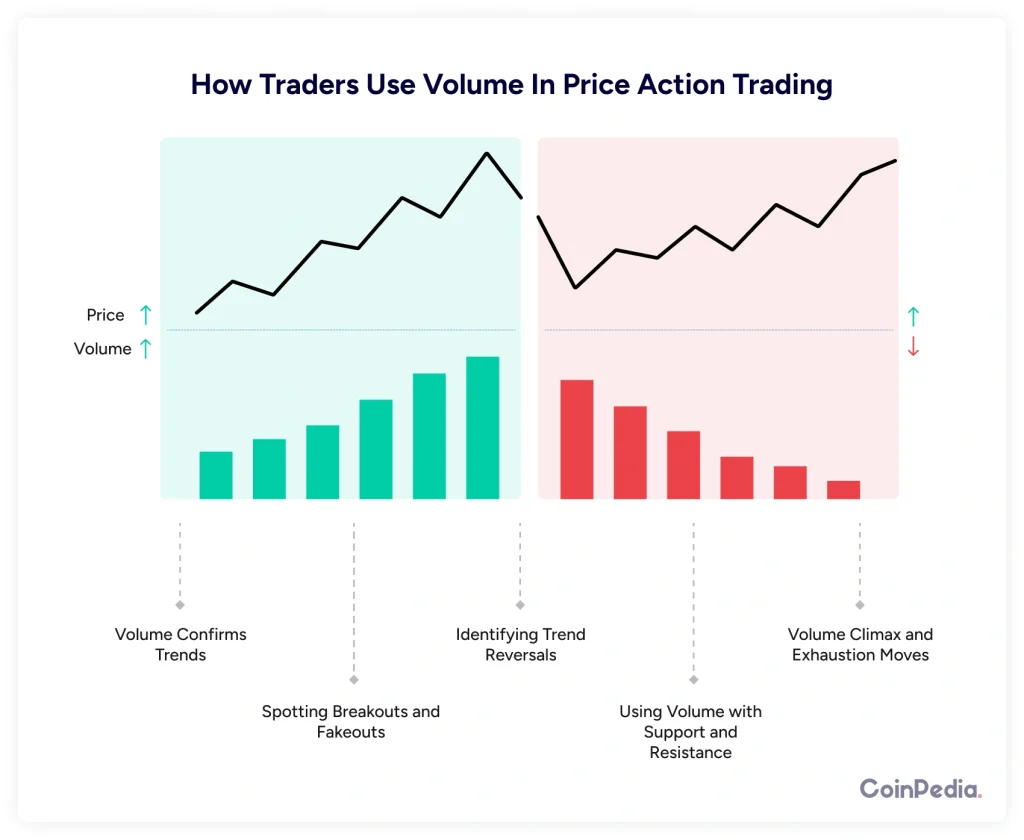
Combining with Trading Volume
/
Understanding volume in crypto price action | Source: Coinpedia
{"align":"center"}Trading volume is the "fuel" of trends:
- Uptrend + increasing volume: Strong signal for continued upward movement
- Uptrend + decreasing volume: Warning that the trend may be weakening
- Resistance breakout + high volume: Strong signal for continued rise
It's crucial to remember that technical analysis isn't 100% accurate all the time. It's just a tool that helps increase the probability of successful trades. The crypto market is particularly volatile and can be influenced by many external factors.
Combine with Fundamental Analysis
For the most comprehensive view, you should combine technical analysis with fundamental analysis. Fundamental analysis examines factors such as:
- Project news and updates
- New partnerships and collaborations
- Technology upgrades
- Legal regulations
- Macroeconomic conditions
Practice with Demo Accounts
Before using real money, practice with demo accounts or small amounts. This helps you become familiar with the tools and develop skills without significant financial risk.
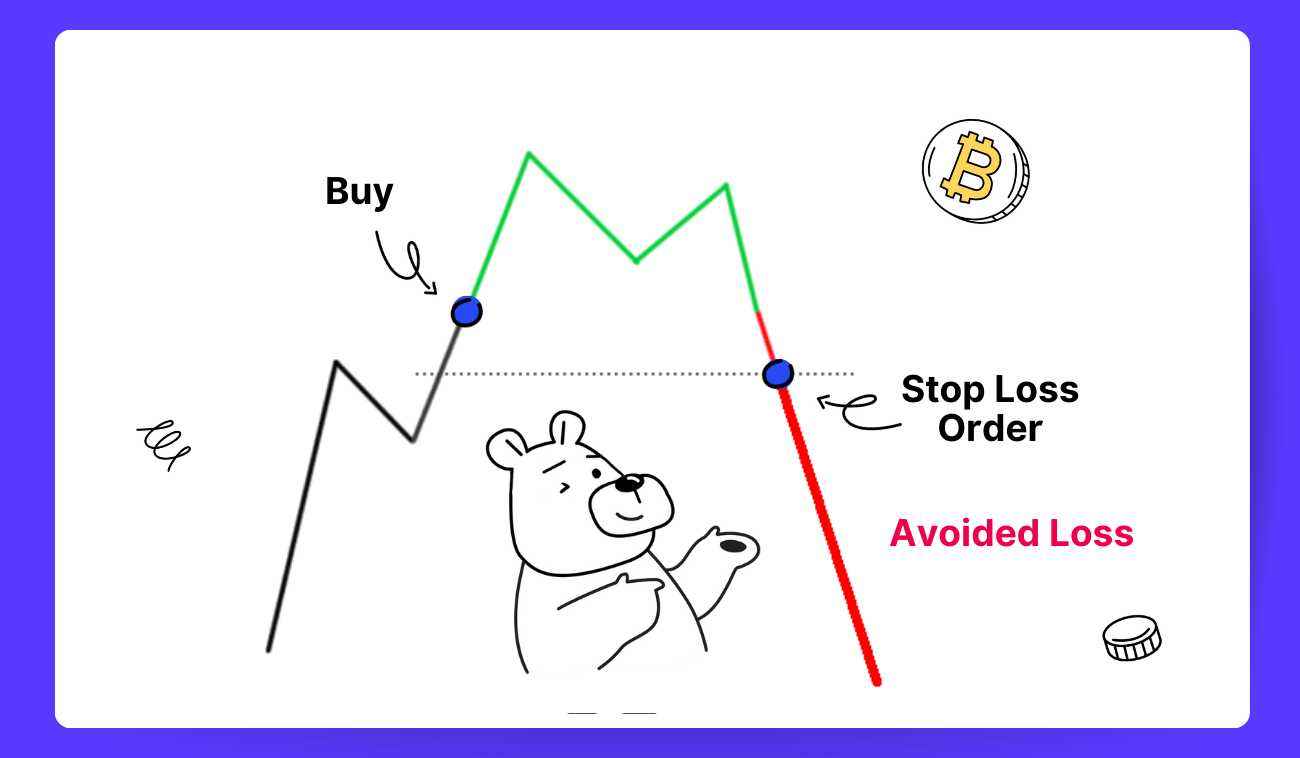
Always Have a Risk Management Plan
/
Essential risk management in crypto trading | Source: Bitsgap
{"align":"center"}No matter how accurate your technical analysis is, risk management remains the most important factor:
- Set stop-losses to limit losses
- Never risk your entire account on a single trade
- Diversify your investment portfolio
When you're learning technical analysis, it's essential to understand that timing matters tremendously in crypto markets. Unlike traditional stock markets that have set trading hours, cryptocurrency markets operate 24/7, which means price movements can happen at any time.
Think of technical analysis as learning to read the market's "body language." Just as you can often tell someone's mood by their posture and facial expressions, you can gauge market sentiment by observing how prices move and where they encounter support or resistance.
The key insight here is that technical analysis works because human psychology remains consistent across different markets and time periods. People still get greedy when prices are rising and fearful when prices are falling, regardless of whether they're trading stocks in 1920 or Bitcoin in 2025.
The Importance of Multiple Time Frame Analysis /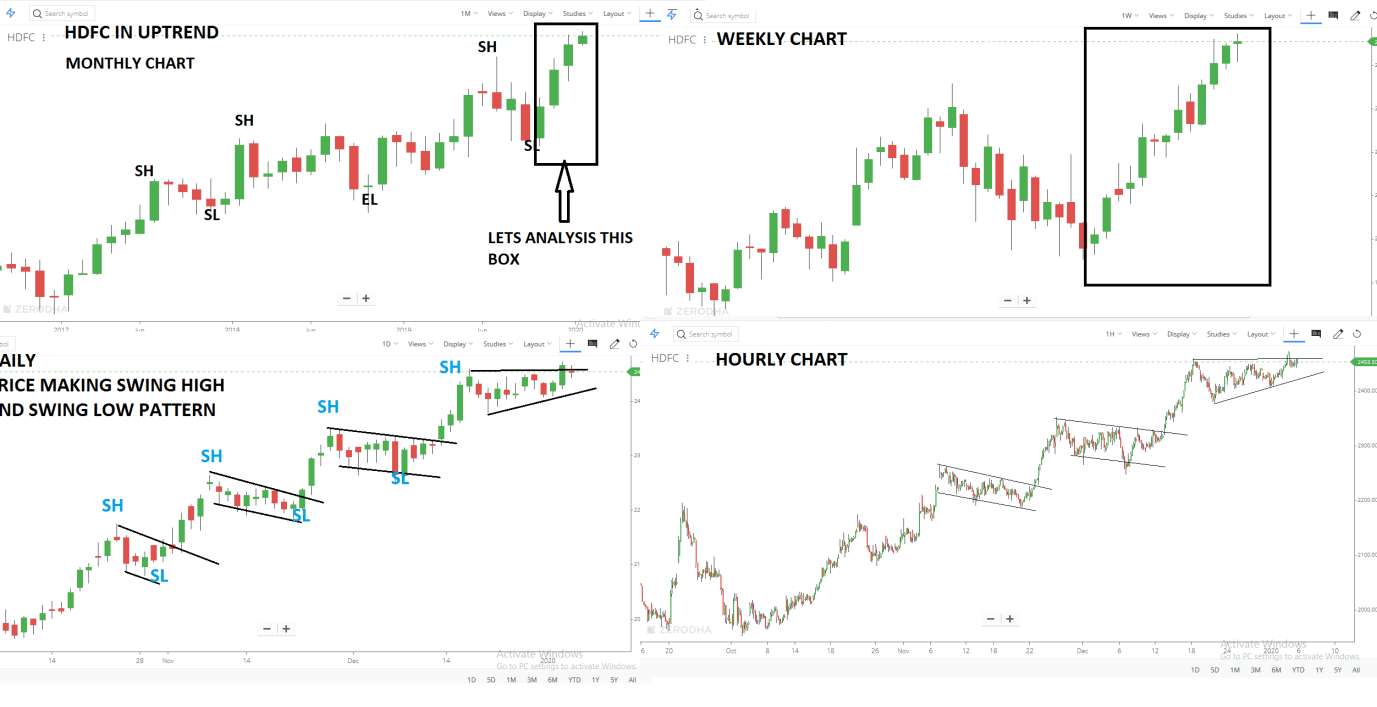
Multi-timeframe trading analysis approach | Source: Dot Net Tutorials
{"align":"center"}One crucial concept that separates successful traders from beginners is the ability to analyze multiple time frames simultaneously. Imagine you're planning a road trip - you need both a detailed street map for immediate navigation and a broader regional map to understand the overall journey.
Similarly, in trading, you might use:
- Daily charts to understand the major trend direction
- 4-hour charts to identify intermediate-term patterns
- 1-hour charts to find precise entry and exit points
This multi-layered approach helps you avoid the common mistake of buying into what appears to be an uptrend on a short time frame, only to discover you're actually trading against a major downtrend on the daily chart.
Volume Analysis: The Market's VoiceWhile price tells you what happened, volume tells you how many people participated in making it happen. High volume during a price breakout suggests strong conviction from traders, while low volume might indicate that the move lacks substance and could reverse.
Think of volume like applause at a concert. Loud, sustained applause suggests the audience genuinely enjoyed the performance, while scattered, quiet clapping might indicate polite but unenthusiastic response. Similarly, price movements accompanied by high volume carry more weight than those with low participation.
Advanced Concepts for Growing Traders /Market Structure and Price ActionAs you develop your skills, you'll begin to recognize that markets have structure. Uptrends are characterized by higher highs and higher lows, while downtrends show lower highs and lower lows. When this structure breaks, it often signals a potential trend change.
Understanding market structure helps you identify when a trend is healthy and likely to continue versus when it's showing signs of exhaustion. This is particularly important in crypto markets, where trends can be extremely powerful but also subject to sudden reversals.
The Psychology Behind Support and Resistance
Support and resistance levels work because they represent psychological levels where traders have made decisions in the past. When Bitcoin approaches a previous high, traders who bought near that level might be eager to break even and sell, creating selling pressure (resistance). Conversely, levels where price has bounced multiple times become support because traders expect buying interest to emerge there again.
These levels become more significant when they align with round numbers (like $50,000 for Bitcoin) or when they coincide with technical indicators like moving averages. The more factors that converge at a particular price level, the more likely that level is to hold significance.
Building Your Trading System /Developing a Systematic ApproachAs you gain experience, you'll want to develop a systematic approach rather than relying on gut feelings or random analysis. This involves creating clear rules for:
- How you identify trends
- What conditions must be met before you enter a trade
- Where you'll place your stop-loss orders
- How you'll determine profit targets
- When you'll exit winning or losing positions
Think of this like developing a recipe for cooking. Once you know the ingredients and steps that work, you can reproduce successful results consistently rather than hoping for lucky outcomes.
The Role of Backtesting
Before implementing any strategy with real money, experienced traders test their ideas on historical data. This process, called backtesting, helps you understand how your strategy would have performed in different market conditions.
While past performance doesn't guarantee future results, backtesting helps you identify potential weaknesses in your approach and gives you confidence in your methods. Many trading platforms now offer backtesting capabilities, making this process more accessible to individual traders.
Common Pitfalls and How to Avoid Them /Overcomplicating Your AnalysisMany beginners make the mistake of using too many indicators simultaneously, creating analysis paralysis. Remember that indicators are derived from price and volume data, so using many indicators often means you're looking at the same information presented in different ways.
Start with simple tools and master them before adding complexity. A trader who thoroughly understands support and resistance levels and moving averages will often outperform someone using a dozen indicators without deep understanding of any.
Ignoring Risk Management
The most common cause of trading failure isn't poor market analysis - it's inadequate risk management. You can be right about market direction 60% of the time and still lose money if your losses are much larger than your gains.
Successful trading is more about preserving capital during losing periods than maximizing profits during winning streaks. Always determine your risk before entering any trade, and never risk more than you can afford to lose on a single position.
ConclusionTechnical analysis is a powerful tool that helps traders better understand market dynamics and make informed trading decisions. However, it's just one piece of the puzzle in successful trading.
To master technical analysis, you need to:
- Learn systematically from basic to advanced concepts
- Practice regularly with different tools and market conditions
- Combine technical analysis with other analytical methods
- Always maintain emotional discipline and stick to your predetermined plan
Remember that becoming a skilled trader takes time and experience. Be patient in your learning process and continuously work to improve your skills. The crypto market always presents new opportunities, and with solid knowledge of technical analysis, you'll have the necessary tools to capture those opportunities intelligently and effectively.
The journey to trading proficiency is like learning any complex skill - it requires dedication, practice, and the willingness to learn from both successes and failures. Technical analysis provides you with a framework for understanding market behavior, but your success will ultimately depend on how well you can combine this knowledge with sound risk management and emotional discipline.
As you continue developing your trading skills, remember that the goal isn't to predict the future with certainty - that's impossible. Instead, technical analysis helps you identify high-probability scenarios and manage your risk accordingly. Focus on making consistently good decisions rather than trying to be right all the time, and you'll be well on your way to becoming a successful crypto trader.