Williams %R Trading Strategy: How to Trade Smarter with Signals
There are many complex indicators in technical analysis, but sometimes simplicity is the key to success. Williams %R trading strategy, introduced by Larry Williams in 1973, is a good example. This oscillator measures the strength of buyers and sellers by comparing the current closing price with the highest and lowest prices over a set period.
The indicator acts as both a trend confirmation tool and a reversal warning signal. In this article, we’ll explain how to calculate it, interpret its signals, and apply two practical strategies that you can start using right away.

Understanding the Williams %R indicator
To use any tool well, you must understand how it works and what the numbers mean. Williams %R is no exception. It has a very simple formula, but it is very effective in measuringmarket momentum.
Williams %R formula
Basically, Williams %R measures where the closing price is relative to the highest and lowest price range over a period of time (Williams_%25R">Williams %R formula ). This period is usually 14 periods (14 days, 14 hours, etc.), depending on the chart you are looking at.

- Highest High: The highest price over the past 14 periods.
- Lowest Low: The lowest price over the past 14 periods.
- Close: The final price of the current candle.
Unlike most oscillators, the Williams %R scale runs from 0 (peak) to -100 (bottom).
- Values near 0 → price is near the period’s high (potentially overbought).
- Values near -100 → price is near the period’s low (potentially oversold).
For example:
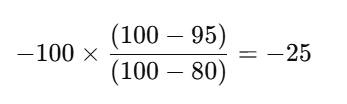
The 14-day high is 100, the low is 80, and the current closing price is 95. We can calculate:
This -25 figure is close to 0, indicating that the price is in a high zone and may be overbought.
Choosing the Right Period
- Shorter period (e.g., 7): Faster signals, useful for short-term trades, but noisier.
- Longer period (e.g., 28): More reliable signals, better for trend trading, but slower.
The best approach is to backtest on your market or asset to find what works.
Effective Trading Strategy With Williams %R
Understanding the theory is one thing, but you need a specific strategy to trade. Here are two ways to use Williams %R effectively. The main rule is to always combine it with other tools to increase accuracy.
Overbought/Oversold Trading Strategy
This is the simplest way to trade with Williams %R.
Buy signal: When the %R line moves up from below -80 and crosses above it. This shows that selling pressure is fading and the price may start to rise.
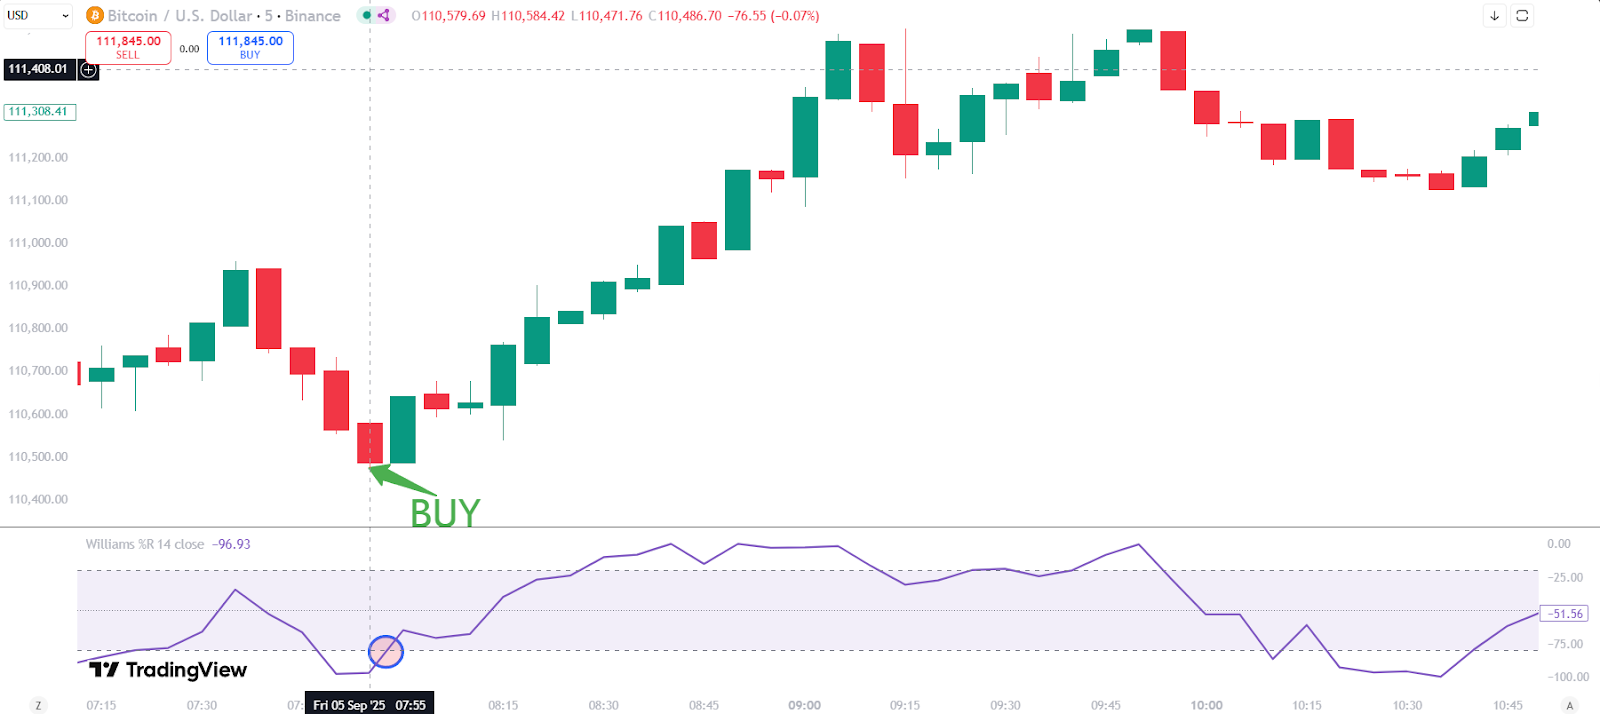
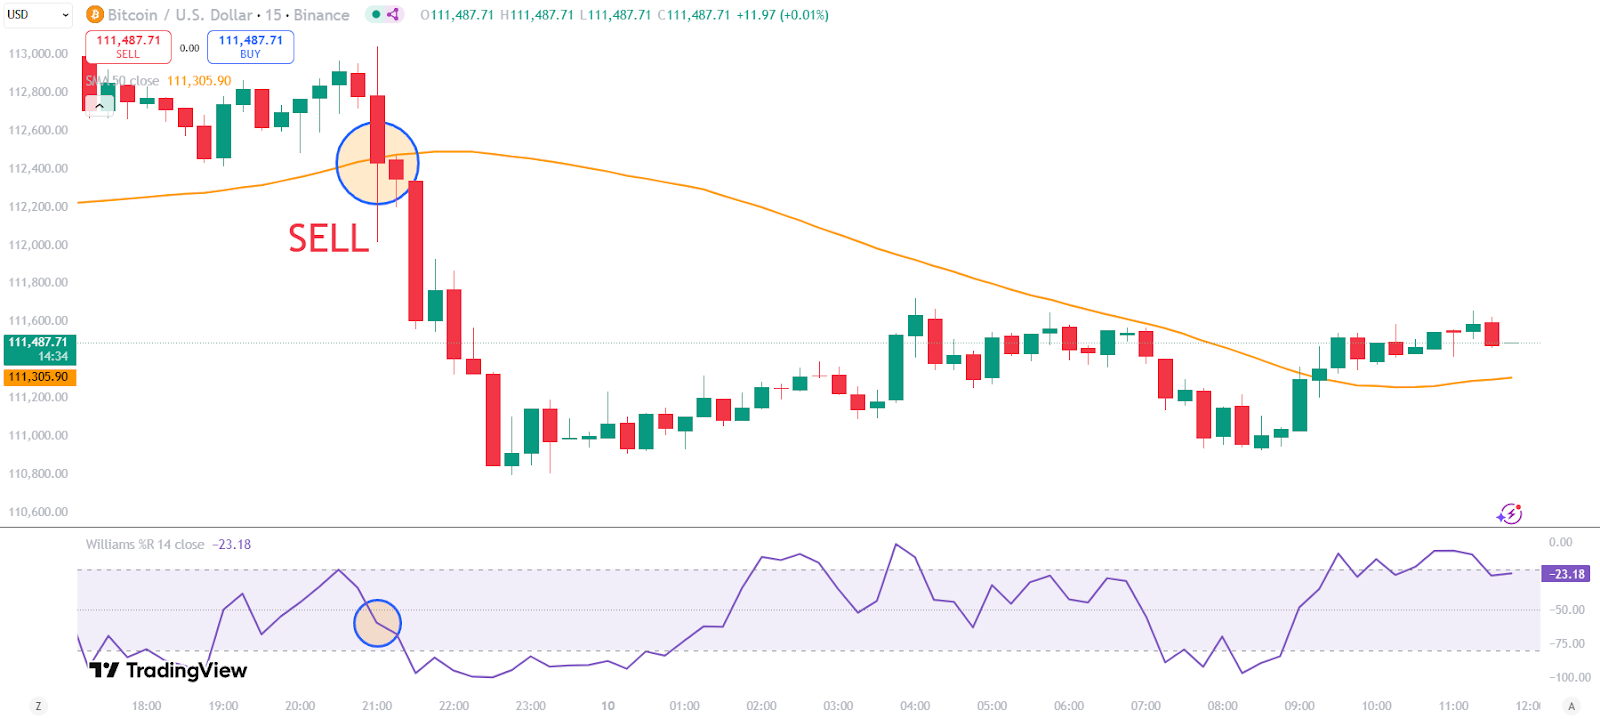
Williams %R crosses above -80, it’s a buy signal. Source: TradingView Sell signal: When the %R line moves down from above -20 and crosses below it. This suggests buyers are losing strength and the price may begin to fall.
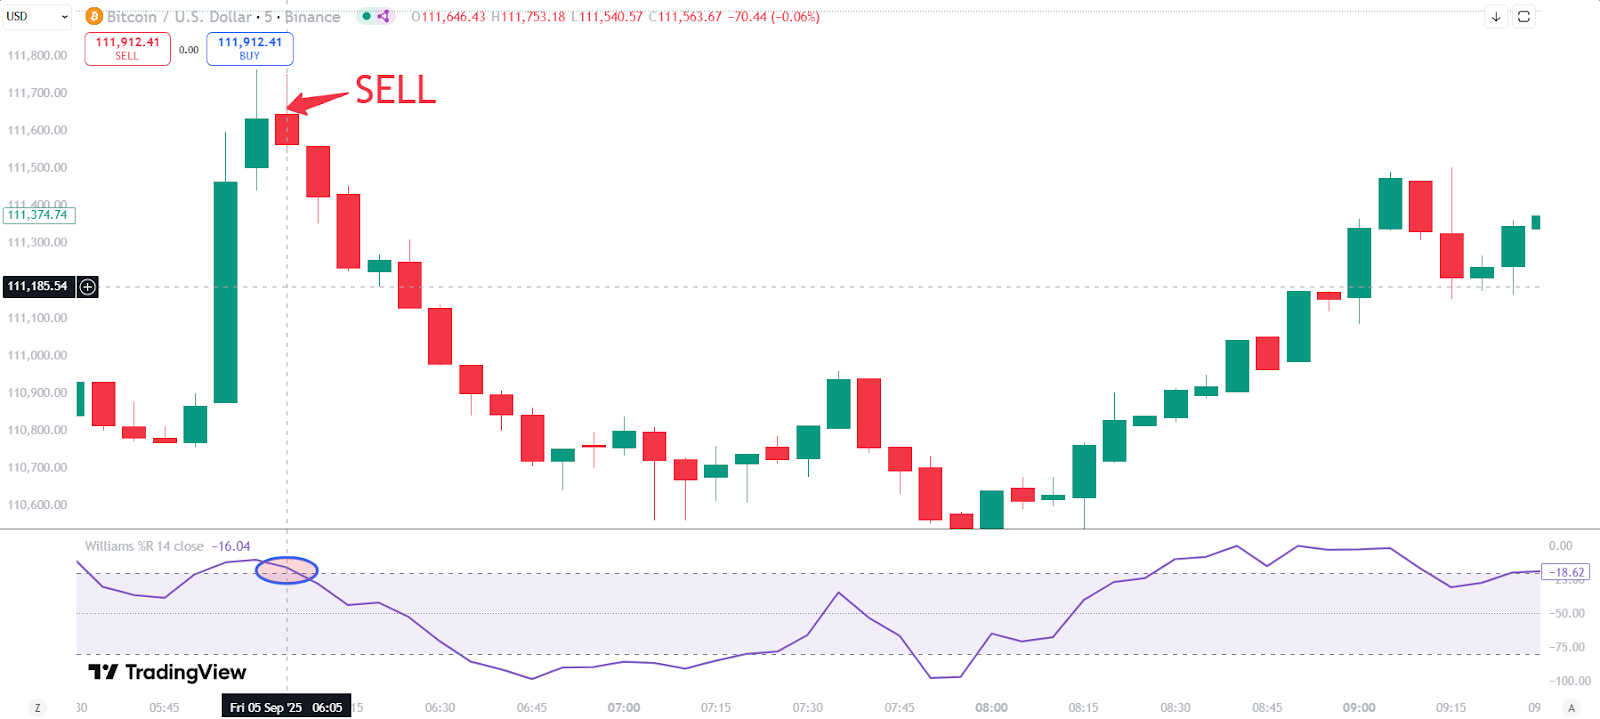
Williams %R drops below -20, it’s a sell signal. Source: TradingViewWilliams %R drops below -20, it’s a sell signal. Source: TradingView
To exit, you can hold a long position until the indicator enters the overbought zone (above -20) to lock in profits. Similarly, you hold a short position until the indicator falls into the oversold zone (below -80) and then close the position.
Combining Williams %R With Moving Average
Combining Williams %R with a moving average makes the signals more reliable. In this strategy, the 50-period moving average (MA50) is used to identify the main trend, while the Williams %R provides entry points. When the price is trading above the MA50, the trend is considered bullish, so you should only look for buying opportunities. A buy signal appears when the Williams %R moves above -50, suggesting momentum is strengthening.
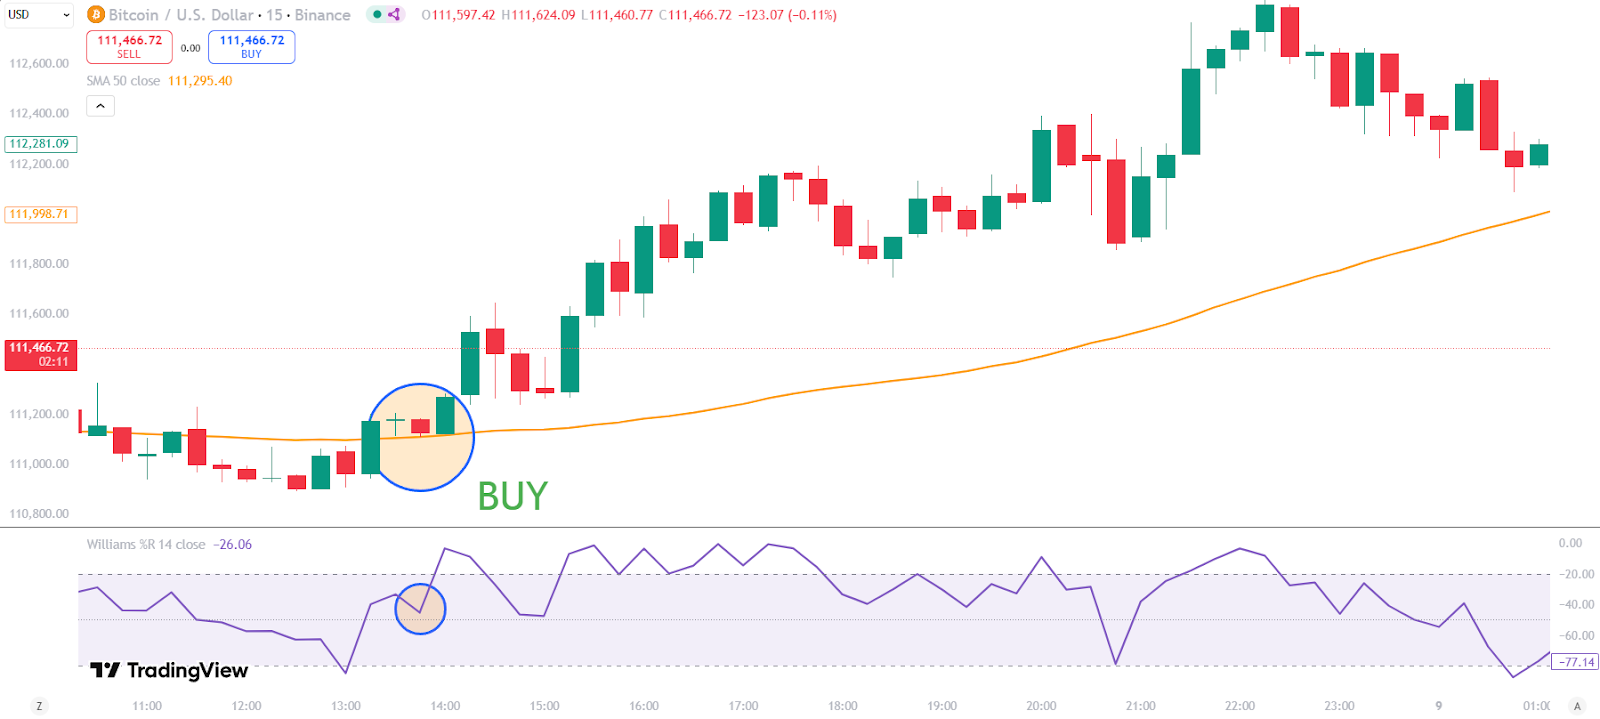
Similarly, when the price is below the MA 50, we only look for selling opportunities. A sell signal is triggered when the Williams %R crosses below -50. The sell order is closed when the %R crosses back above -50 or the price crosses above the MA 50. This approach helps you to always trade in the direction of the main trend and avoids many false signals.
Although it was created decades ago, Williams %R remains a highly effective indicator for gauging market momentum and the balance between buyers and sellers. When used with complementary tools like moving averages or multi-timeframe analysis, it can serve as a powerful trading ally.
That said, no indicator delivers perfect accuracy. Long-term success depends on combining multiple tools, applying strict risk management, and maintaining discipline. Always backtest your approach and practice on a demo account before committing real capital.
Good luck with your trades!