RSI: How Masters Read Signals and Trade with Precision
Let’s continue our indicator strategy series. After exploring the Williams %R strategy, we now turn to one of the most trusted tools in technical analysis: the Relative Strength Index (RSI).
Developed in 1978 by J. Welles Wilder Jr., the Relative Strength Index has become a benchmark for measuring market momentum. It highlights overbought and oversold conditions and reveals early signals of possible reversals. This article breaks down how RSI works, what its values mean, and how to trade with precision using this timeless indicator.
Understanding the RSI indicator
RSI measures the strength and speed of price movements. It compares the average gains and losses over a set period, usually 14 sessions, and displays the result on a scale from 0 to 100. The higher the RSI, the stronger the buying momentum; the lower the RSI, the stronger the selling force. Traders use it to gauge when the market becomes stretched and prepare for a potential shift in direction.
RSI Formula
The RSI, or Relative Strength Index, moves between 0 and 100 to visualize market momentum. Most traders use a 14-period setting. Here’s how it’s calculated step by step:
Step 1: Calculate Average Gain and Average Loss
We need to determine the Gain (G) and Loss (L) of the closing price for each period.
- Gain (G): If today’s closing price is higher than yesterday’s,
G=(Today’s Close−Yesterday’s Close)
If the price decreases, then G=0. - Loss (L): If today’s closing price is lower than yesterday’s,
L=(Yesterday’s Close−Today’s Close, which is always a positive value.
If the price increases, then L=0
Next, calculate the average of these values over N periods (typically N = 14):
- Average Gain (AG): The average of gains over N periods.
- Average Loss (AL): The average of losses over N periods.
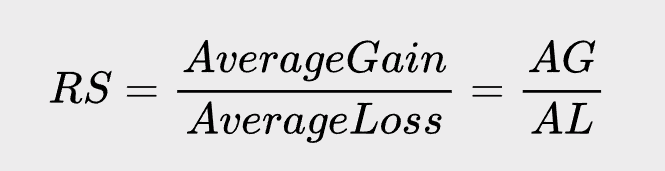
Step 2: Find the Relative Strength (RS)
The RS is simply the ratio between the Average Gain and the Average Loss. This ratio shows whether buyers or sellers are in control. Here’s the formula:
Interpretation:
- RS > 1: Average gain is greater than average loss → buying pressure dominates.
- RS < 1: Average loss is greater than average gain → selling pressure dominates.
- RS = 1: Buying and selling pressures are balanced.
Step 3: Convert to a 0–100 Scale (RSI)
Finally, transform RS into Relative Strength Index using the standard formula:
Basic Signal Analysis:
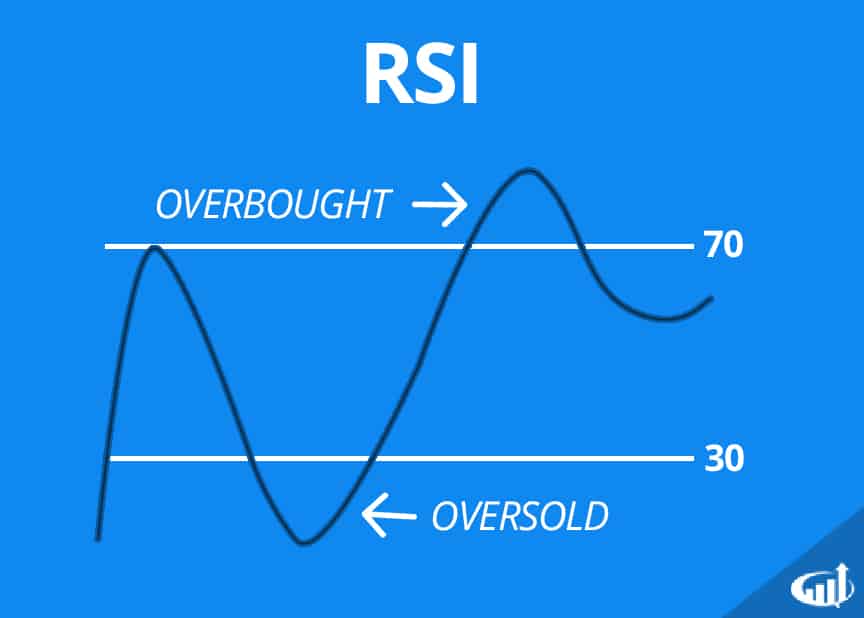
Relative Strength Index helps identify when price momentum stretches too far in one direction. Traders often watch two key zones on the 0–100 scale:
- Overbought (Above 70): Signals strong bullish momentum and a possible cooling phase ahead. The market may be preparing for a pullback or short-term correction.
- Oversold (Below 30): Reflects strong bearish momentum and growing recovery potential. Buyers may soon step in as selling pressure weakens.
⚠️ Important Note: In powerful trends, RSI can stay extended for a long time. Always align your trades with the dominant direction instead of chasing short-term reversals.
RSI Divergence and RSI Reversal
RSI becomes most valuable when price action and momentum start to disagree. These shifts often appear before a trend change.
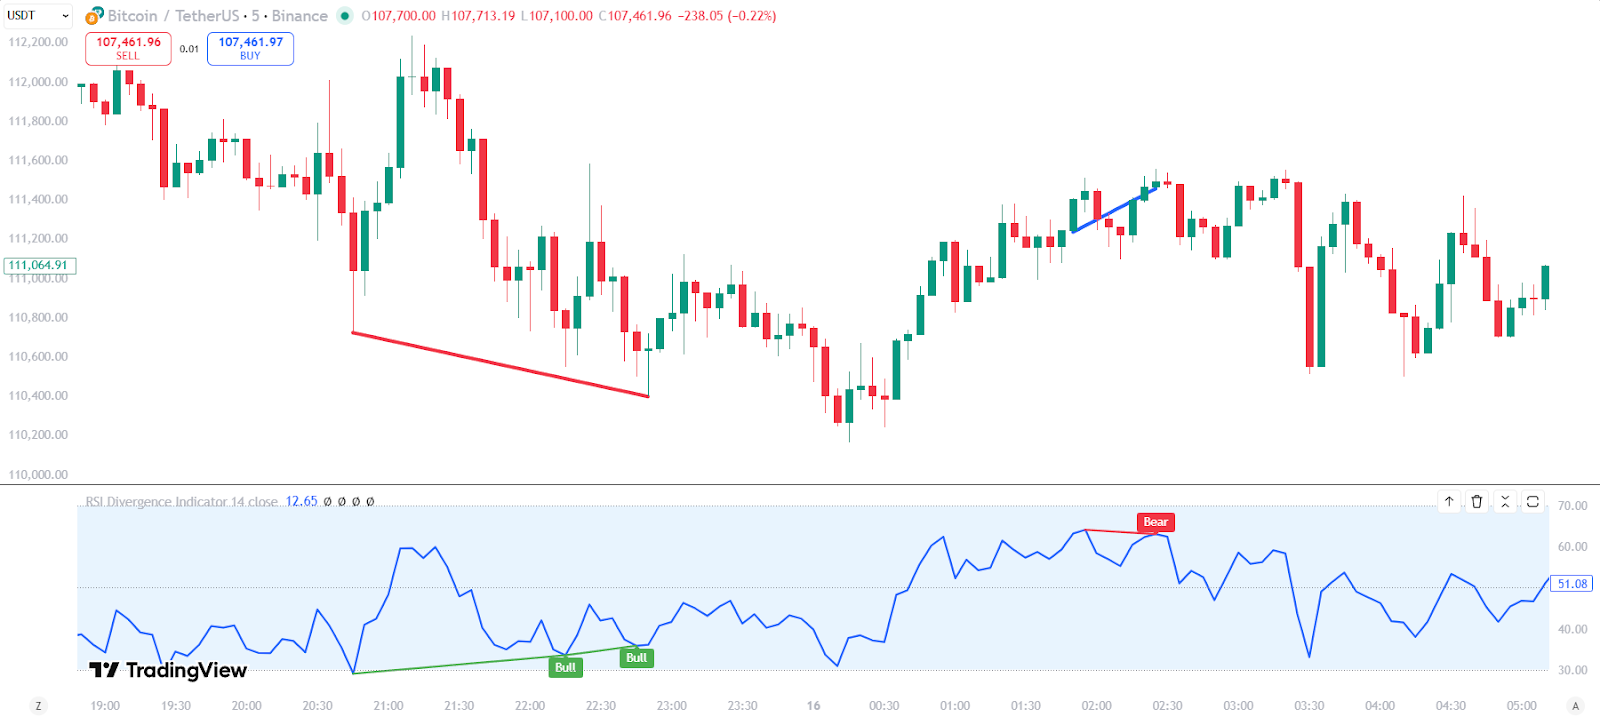
* RSI Divergence:
Divergence happens when price and RSI move in opposite directions, hinting that momentum is fading and a reversal may be near.
- Bullish divergence: Price makes a lower low while RSI forms a higher low → signals growing buying strength.
- Bearish divergence: Price makes a higher high while RSI forms a lower high → signals weakening momentum and possible downside pressure.
* RSI Reversal
Reversals occur when RSI forms a pattern that contrasts with price behavior.
- Positive RSI Reversal: It makes a lower low while price makes a higher low → potential buy setup.
- Negative RSI Reversal: It makes a higher high while price makes a lower high → potential sell setup.
These signals often appear near the end of strong moves, helping traders anticipate turning points with greater accuracy.
Effective Trading Strategies With RSI
After mastering the basics, it’s time to put Relative Strength Index into action. Below are two proven ways to use it for timing entries and exits with precision.
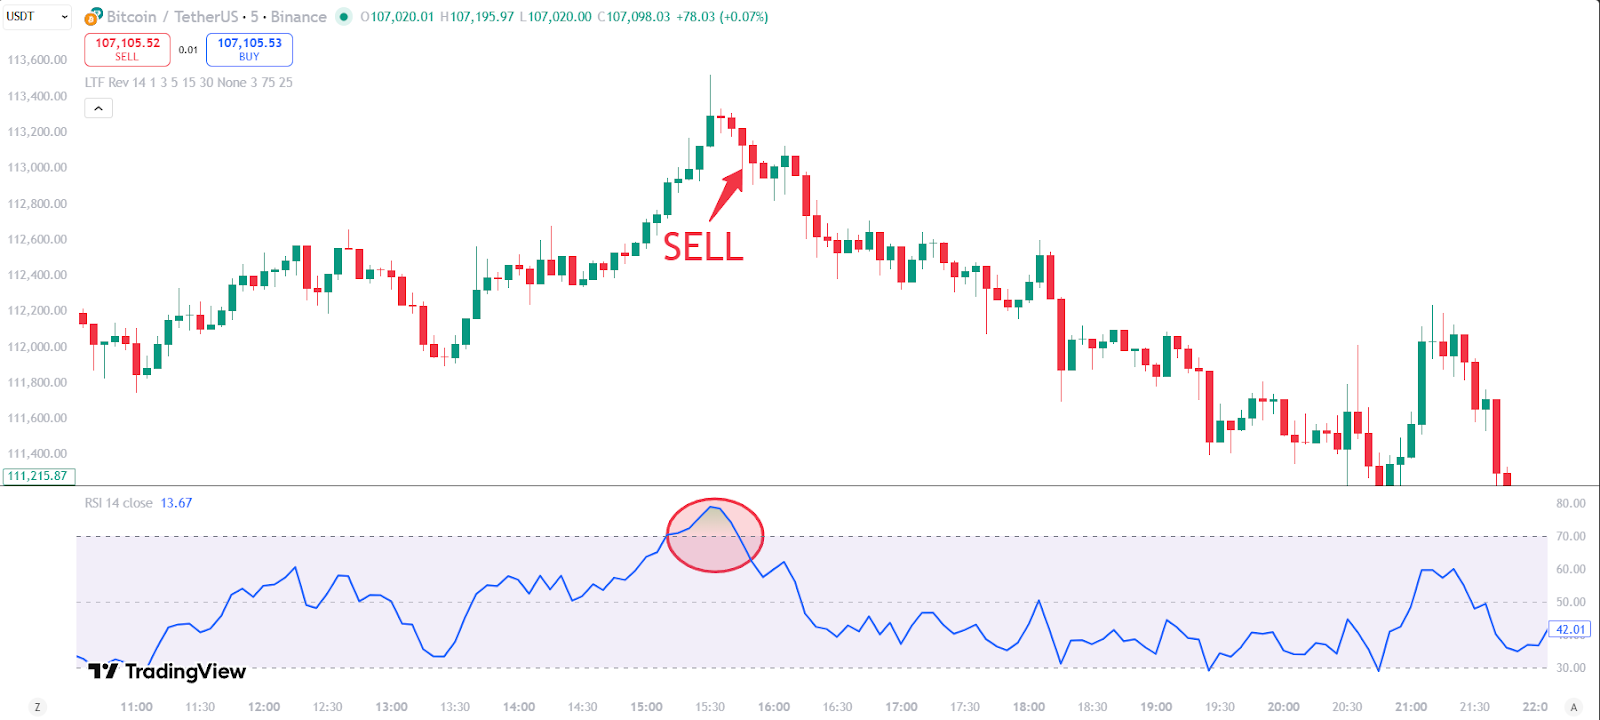
1) Early Reversal with Crossover 30/70
This classic approach works best for catching short-term turning points..
- Buy Order: Wait for RSI to fall below 30, then cross back above it. Confirm the signal when the candle closes, it shows renewed buying momentum.
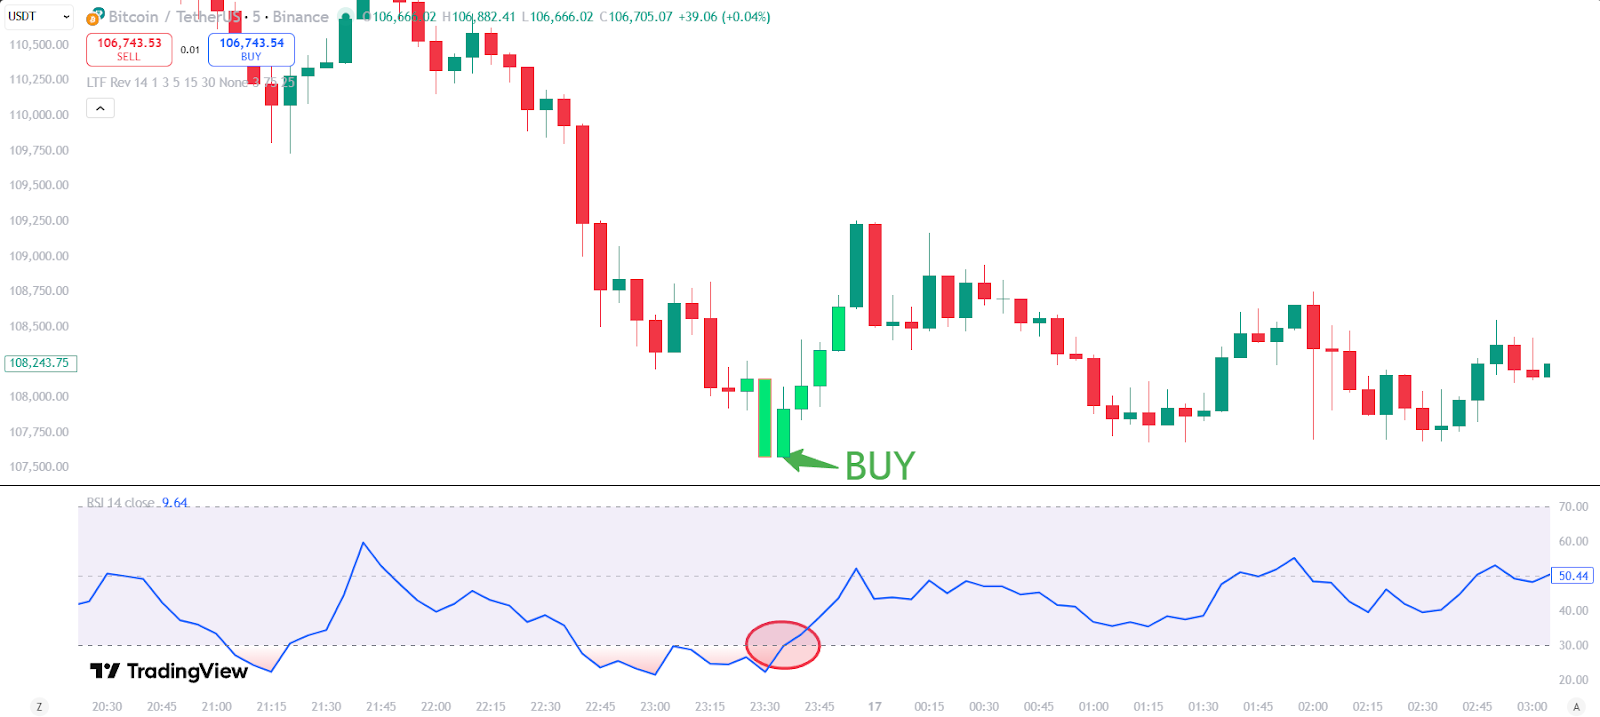
- Sell Order: Wait for RSI to rise above 70, then cross back below it. The move signals fading strength and potential downside pressure.
2) Using RSI with additional Indicators
Relative Strength Index becomes even stronger when used with trend filters such as the 200-period Moving Average (MA200). This setup filters noise and focuses only on trades aligned with the main trend.
* Core Principle:
- When the price is above MA200 → The market is in an uptrend → Only look for BUY signals.
- When the price is below MA200 → The market is in a downtrend → Only look for SELL signals.
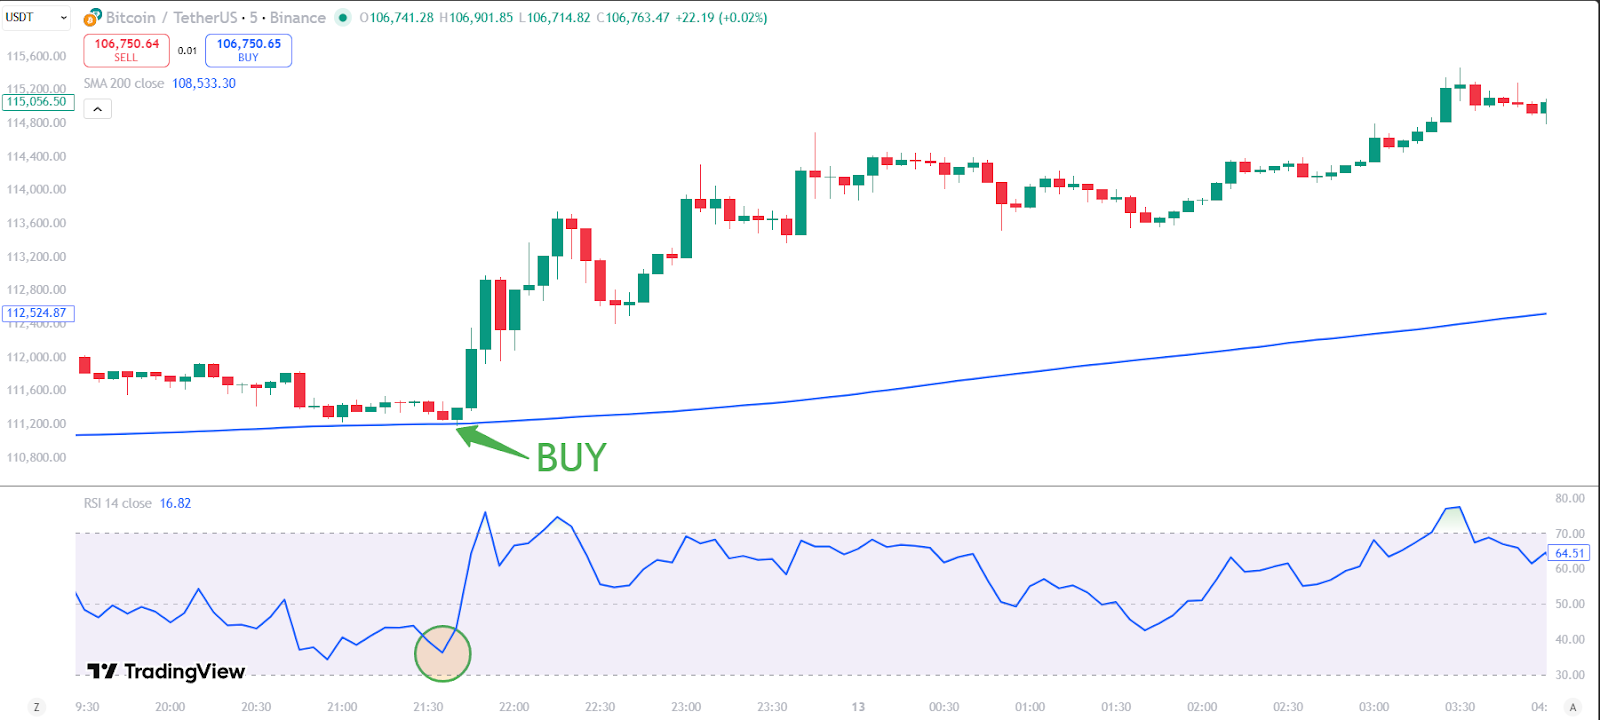
- Buy strategy (uptrend):
1. Confirm price stays above MA200.
2. Wait patiently for a correction that causes RSI to drop to the 50 or even 30 zone — this is a “buy on pause” opportunity.
3. Enter a BUY order when RSI crosses back above 30 or 50, indicating a return of bullish momentum.
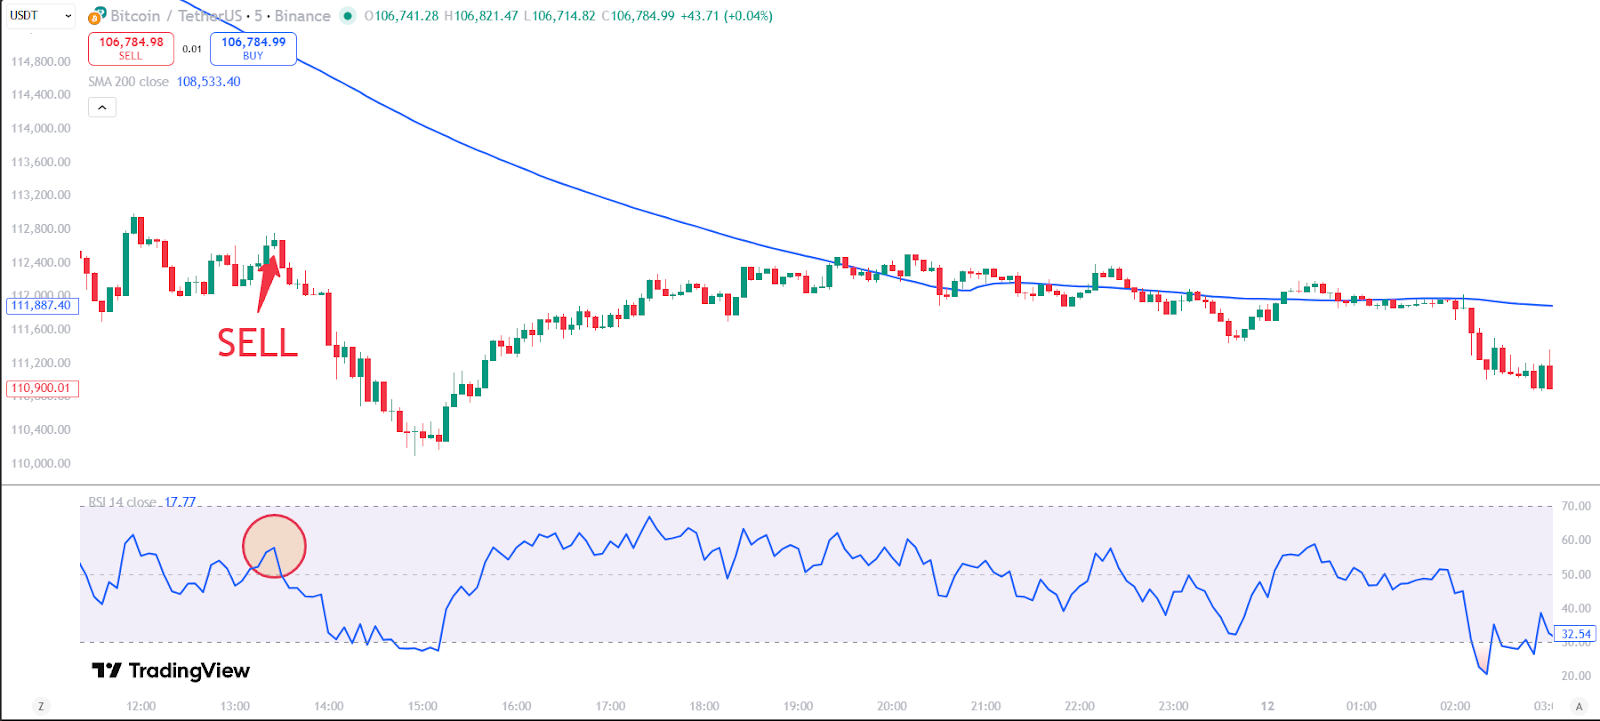
- SELL strategy (downtrend):
1. Confirm price stays below MA200.
2. Wait for a rally that causes RSI to rise to the 50 or 70 zone.
3. Enter a SELL order when RSI crosses below 70 or 50, indicating a continuation of bearish momentum.
When used with patience and discipline, these strategies help traders capture momentum shifts without chasing every move.
Conclusion
Relative Strength Index stands as one of the most reliable tools in technical analysis. Decades after its creation, it still delivers sharp insights into market momentum and trend strength. When paired with clear trend confirmation and solid risk management, RSI transforms from a simple oscillator into a precision instrument for timing trades.
Success with it comes from consistency: reading momentum, following structure, and executing with focus. Master it, and Relative Strength Index will guide you through market shifts with confidence and clarity.